Drawing NetworkX Network Graphs in python3

NetworkX is a Python library for working with graph structures and network relationships. It is useful for creating graphs, analyzing graph structure, and quickly drawing connection diagrams from tabular data.
With NetworkX, you can import graph data from multiple formats, generate classic graph structures, and combine it with matplotlib for practical visualizations.
This article focuses on three practical tasks:
- Draw a basic node-edge graph
- Style edges by weight and importance
- Change the figure background for presentation-friendly output
1. Drawing the Most Basic Network Graph
A network graph consists of nodes and edges. In NetworkX, each row of a pandas DataFrame represents the points in a connection, and a connection is generated at the corresponding position. In the example, a connection is generated between each corresponding position of ‘from’ and ’to’.
import pandas as pd
import networkx as nx
import matplotlib.pyplot as plt

df = pd.DataFrame({
    'from': ['A', 'B', 'C', 'A'],
    'to': ['D', 'A', 'E', 'C']
})

basic_net = nx.from_pandas_edgelist(df, 'from', 'to')
fig = plt.figure()
nx.draw(basic_net, with_labels=True)
plt.show()
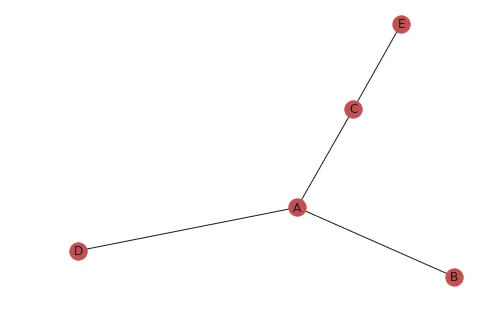
Drawing a network graph using NetworkX only requires the simple steps above.
1. Importing Data
basic_net = nx.from_pandas_edgelist(df, 'from', 'to'). NetworkX supports multiple graph input formats, and the official convert documentation is the best place to explore alternatives such as adjacency-matrix import.
2. Drawing the Graph
nx.draw(basic_net, with_labels=True)
3. Display
plt.show()
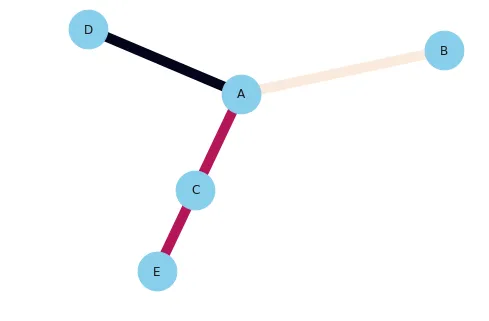
2. Differentiating Connection Colors and Sizes Between Nodes
Since the importance of connections between different nodes varies, using line segments or colors of different sizes for connections becomes extremely important. NetworkX conveniently provides this function; you just need to specify edge_color during the drawing process.
import pandas as pd
import networkx as nx
import matplotlib.pyplot as plt

df = pd.DataFrame({
    'from': ['A', 'B', 'C', 'A'],
    'to': ['D', 'A', 'E', 'C'],
    'value': [1, 10, 5, 5]
})

color_net = nx.from_pandas_edgelist(df, 'from', 'to', create_using=nx.Graph())
fig = plt.figure()
nx.draw(
    color_net,
    with_labels=True,
    node_color='skyblue',
    node_size=1500,
    edge_color=df['value'],
    width=10.0
)
plt.show()
3. Setting Network Graph Background Color
In NetworkX, you can set the background color simply by using set_facecolor.
import pandas as pd
import networkx as nx
import matplotlib.pyplot as plt

df = pd.DataFrame({
    'from': ['A', 'B', 'C', 'A'],
    'to': ['D', 'A', 'E', 'C'],
    'value': [1, 10, 5, 5]
})

color_net = nx.from_pandas_edgelist(df, 'from', 'to', create_using=nx.Graph())
fig = plt.figure()
nx.draw(
    color_net,
    with_labels=True,
    node_color='skyblue',
    node_size=1500,
    edge_color=df['value'],
    width=10.0
)
fig.set_facecolor("#AAAA00")
plt.show()
Two quick practical tips
- If the graph has many nodes, adjust the layout first before tuning colors and sizes, otherwise the plot becomes hard to read.
- If edge weights vary a lot, bind both
widthandedge_colorto the weights so important relationships stand out immediately.
Useful layout functions include:
nx.spring_layout(color_net)
nx.circular_layout(color_net)
nx.shell_layout(color_net)
Summary
This article covered the basics of drawing network graphs with NetworkX, including basic edges, weighted edge styling, and simple visual polish. If you are starting with relationship-data visualization in Python, NetworkX is still one of the fastest tools to get working results. For more detail, see the NetworkX Official Documentation.
- 原文作者:春江暮客
- 原文链接:https://www.bobobk.com/en/229.html
- 版权声明:本作品采用 知识共享署名-非商业性使用-禁止演绎 4.0 国际许可协议 进行许可,非商业转载请注明出处(作者,原文链接),商业转载请联系作者获得授权。