TypeError: ufunc 'isnan' not supported for the input types - Solution
Today, while using Python’s Seaborn to plot a heatmap (clustermap), I kept encountering this error. My data seemed perfectly fine, and a Google search didn’t yield any good solutions. After some exploration, I’m sharing the final solution here.
Although the error appears inside Seaborn, the more common root cause is that the DataFrame being passed into plotting has become object dtype instead of a numeric dtype.
1. Generating the DataFrame
import pandas as pd
import numpy as np
import matplotlib.pyplot as plt
from seaborn import clustermap
import seaborn as sns; sns.set(color_codes=True)
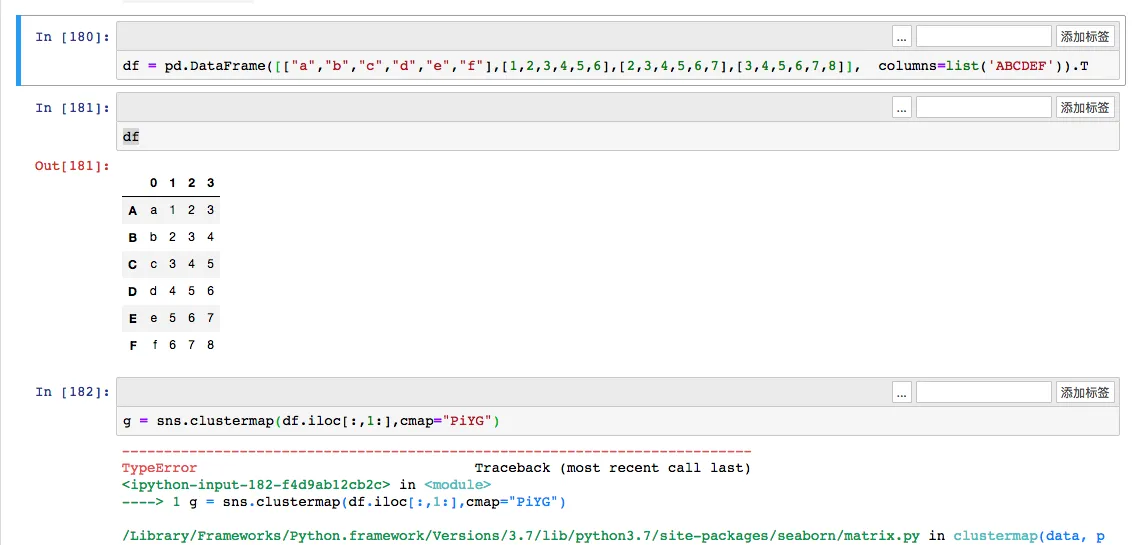
df = pd.DataFrame([["a","b","c","d","e","f"],[1,2,3,4,5,6],[2,3,4,5,6,7],[3,4,5,6,7,8]], columns=list('ABCDEF')).T
df
g = sns.clustermap(df.iloc[:,1:],cmap="PiYG")
After generating and transposing the DataFrame, a TypeError occurs: TypeError: ufunc 'isnan' not supported for the input types, and the inputs could not be safely coerced to any supported types according to the casting rule "safe".
2. Cause of the Error
This type of error arises because the DataFrame has been transposed, and the original DataFrame contained string columns. Just like in the example above, the first column contains strings (values ‘abcdef’). When transposed, all numerical values in the DataFrame are also converted to object types instead of float or int numerical types. Therefore, trying to plot a heatmap with character types naturally leads to an error.
Note that if the DataFrame originally contained only numerical types, this issue wouldn’t occur.
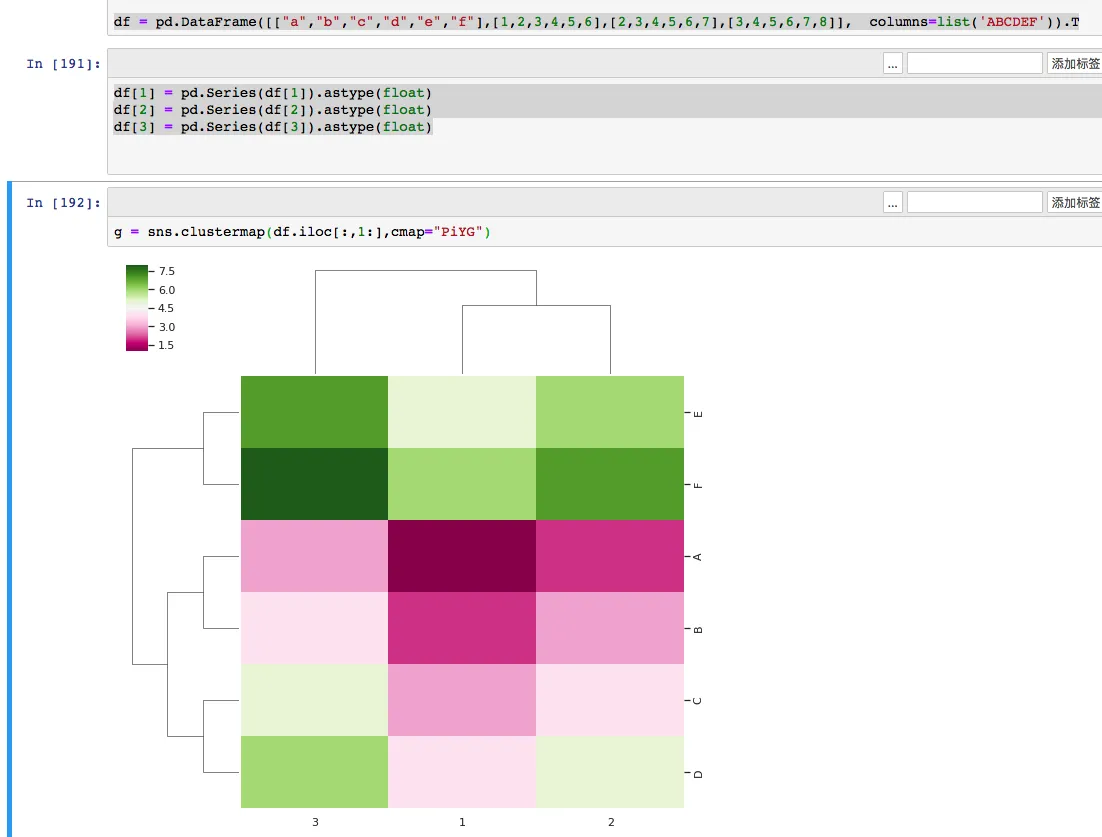
3. Solution
Knowing the cause makes the solution simple: convert the relevant columns in the transposed DataFrame back to numeric types. In practice, a batch conversion is more useful than manually calling astype(float) for each column.
    import pandas as pd
    import numpy as np
    import matplotlib.pyplot as plt
    from seaborn import clustermap
    import seaborn as sns; sns.set(color_codes=True)
    df = pd.DataFrame([["a","b","c","d","e","f"],[1,2,3,4,5,6],[2,3,4,5,6,7],[3,4,5,6,7,8]],  columns=list('ABCDEF')).T
    df.iloc[:, 1:] = df.iloc[:, 1:].apply(pd.to_numeric, errors="coerce")
    print(df.dtypes)
    g = sns.clustermap(df.iloc[:,1:],cmap="PiYG")
The advantage of pd.to_numeric(..., errors="coerce") is that it scales better when there are many columns, and any value that still cannot be converted becomes NaN, which is usually easier to debug than leaving the whole column as object.
If you want to confirm the diagnosis first, print the dtypes before plotting:
print(df.dtypes)
If the part of the DataFrame passed into Seaborn is still object, this isnan error is very likely to appear again.
- 原文作者:春江暮客
- 原文链接:https://www.bobobk.com/en/245.html
- 版权声明:本作品采用 知识共享署名-非商业性使用-禁止演绎 4.0 国际许可协议 进行许可,非商业转载请注明出处(作者,原文链接),商业转载请联系作者获得授权。