Python to draw horizontal and vertical lines as dividing lines
When plotting, you often encounter situations where you need to add dividing lines. So, which functions in Python can conveniently draw horizontal or vertical lines? Below are two functions that can easily add horizontal or vertical lines.
1. Using matplotlib.pyplot’s hlines and vlines
######Import required modules
import numpy as np
import matplotlib.pyplot as plt
######This is the butterfly curve part
t = np.arange(0.0, 12*np.pi, 0.01)
x = np.sin(t)*(np.e**np.cos(t) - 2*np.cos(4*t)-np.sin(t/12)**5)
y = np.cos(t)*(np.e**np.cos(t) - 2*np.cos(4*t)-np.sin(t/12)**5)
plt.figure(figsize=(8,6))
plt.plot(x,y,color='blue',linewidth = '3')
#######This is the dividing line part
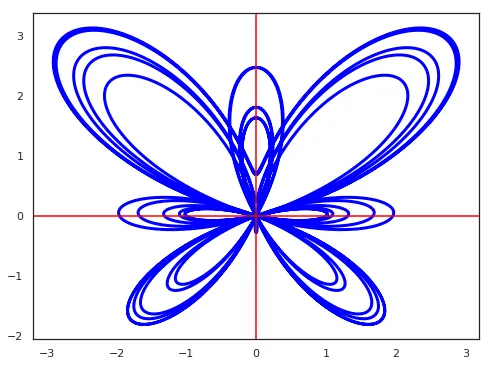
plt.hlines(0, -3, 3,color="red")#Horizontal line
plt.vlines(0, -2, 3,color="red")#Vertical line
matplotlib.pyplot.hlines(y, xmin, xmax) represents a horizontal line, with parameters (y-value, starting x-coordinate of the horizontal line, ending x-coordinate of the horizontal line).
matplotlib.pyplot.vlines(x, ymin, ymax) represents a vertical line, with parameters (x-value, starting y-coordinate, ending y-coordinate).
2. Using matplotlib.pyplot’s axhline and axvline
######Import modules
import numpy as np
import matplotlib.pyplot as plt
######This is the butterfly curve part
t = np.arange(0.0, 12*np.pi, 0.01)
x = np.sin(t)*(np.e**np.cos(t) - 2*np.cos(4*t)-np.sin(t/12)**5)
y = np.cos(t)*(np.e**np.cos(t) - 2*np.cos(4*t)-np.sin(t/12)**5)
plt.figure(figsize=(8,6))
plt.plot(x,y,color='blue',linewidth = '3')
#######This is the dividing line part
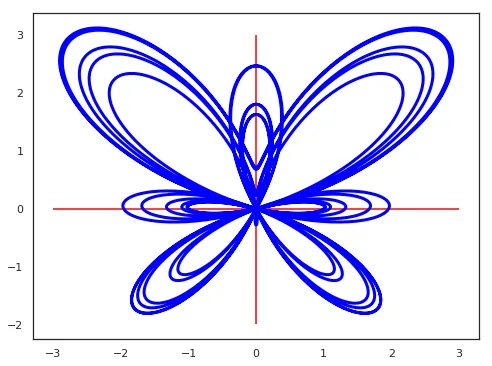
plt.axhline(0, color="red")#Horizontal line
plt.axvline(0, color="red")#Vertical line
matplotlib.pyplot.axhline(y) draws a horizontal line across the current axes.
matplotlib.pyplot.axvline(x) draws a vertical line across the current axes.
Summary
hlines and axhline can both draw horizontal lines, but they solve slightly different problems. hlines is better when you want a line segment with explicit start and end positions, while axhline is better when you want a full-width reference line.
Similarly, vlines is useful for a bounded vertical segment, while axvline is useful for a full-height vertical reference line.
Please choose different matplotlib.pyplot functions as needed.
- 原文作者:春江暮客
- 原文链接:https://www.bobobk.com/en/213.html
- 版权声明:本作品采用 知识共享署名-非商业性使用-禁止演绎 4.0 国际许可协议 进行许可,非商业转载请注明出处(作者,原文链接),商业转载请联系作者获得授权。