包含标签 python 的文章
Decoding Real Addresses from Xunlei Thunder Download Links
Longest Palindromic Substring Algorithm - Manacher
Finding Common Values in Two Python Lists
Detailed Examples of Seaborn Plotting Kernel Density Curves
In a frequency distribution histogram, when the sample size is sufficiently enlarged to its limit, and the bin width is infinitely shortened, the step-like broken line in the frequency histogram will evolve into a smooth curve. This curve is called the density distribution curve of the population.
In this article, Chunjing Muke will detail how to use the Python plotting library Seaborn and the Iris flower dataset from Pandas to plot various cool density curves.
1. Basic Density Curve
import seaborn as sns
sns.set(color_codes=True)
sns.set_style("white")
df = pd.read_csv('iris.csv')
sns.kdeplot(df['sepal_width'])
To plot a kernel density curve using Seaborn, you only need to use kdeplot
. Note that a density curve only requires one variable; here we choose the sepal_width
column.
2. Density Curve with Shading
import seaborn as sns
sns.set(color_codes=True)
sns.set_style("white")
df = pd.read_csv('iris.csv')
sns.kdeplot(df['sepal_width'],shade=True)
Python Implementation for Kugou Music MP3 Download
After implementing python for Qianqian Music mp3 download, some users found that many songs couldn’t be searched on Qianqian Music. So today, Chunjian Muke extended the download functionality to Kugou Music, with source code provided.
Using the same approach, first search for a song directly on the Kugou official website. Then, open the network monitor in Google Chrome and search for the same keyword again. You’ll then be able to find the API information (Note: It’s best to view the network requests during the second search to filter out unnecessary information).
1. Analyzing Search API Information
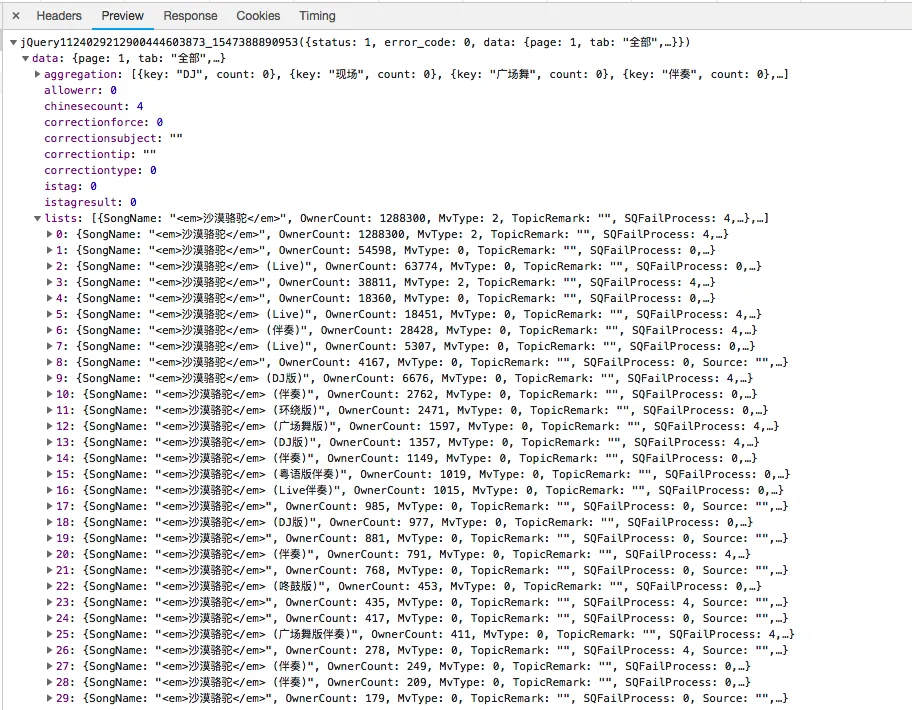
With only 4 network requests, it’s easy to identify that the first request genuinely returns song information, so we can construct this request.
The difference between shadowcopy and deepcopy in python
In python, it is common to need to copy specific objects, and you might encounter various bugs because understanding the difference between these three operations is key: assignment, shallow copy, and deep copy.
Assignment (=), shallow copy (copy), and deep copy (deepcopy) are relatively easy to distinguish regarding assignment vs. copying, but shallow copy and deep copy are harder to differentiate.
The assignment statement does not copy the object; it simply binds the variable to the object. Any change to one object will affect the other. Copying allows you to change one object without affecting the other.
The difference between shallow and deep copy is that shallow copy does not affect the other object when values change, but adding or deleting elements can affect it. Deep copy creates a completely independent object, and changes to one will not affect the other.
……python3 requests module usage examples
Python Random Strong Password Generator
Kaggle Local Dog Breed Recognition
Introduction to Artificial Neural Networks
Drawing the Butterfly Curve with Python
The butterfly curve, discovered by Temple H. Fay, is a beautiful curve that can be expressed using a polar coordinate function. Because of its elegance, I wanted to use it as my blog’s favicon.ico. Here, I’ll use Python’s matplotlib.pyplot package to draw the desired butterfly curve. First, let’s admire the beautiful butterfly curve.
1. First, We Need to Define the Mathematical Expression of the Butterfly Curve
It can also be expressed using spherical coordinates:
2. Choosing matplotlib.pyplot
as the Plotting Tool in Python
1. First, import the necessary Python packages
import numpy as np
import matplotlib.pyplot as plt
2. Set the parameter values
t = np.arange(0.0, 12*np.pi, 0.01)
x = np.sin(t)*(np.e**np.cos(t) - 2*np.cos(4*t)-np.sin(t/12)**5)
y = np.cos(t)*(np.e**np.cos(t) - 2*np.cos(4*t)-np.sin(t/12)**5)
3. According to the formula, use numpy
functions with plt
to draw the required image
plt.figure(figsize=(8,6))
plt.axis('off')
plt.plot(x,y,color='blue',linewidth = '2')
#plt.show()
plt.savefig("butter.jpg",dpi=400)
4. Use Pillow
to resize the image to an appropriate size for a favicon
from PIL import Image
im = Image.open("butter.jpg")
favicon = im.resize((50,50))
favicon.save("favicon.ico")