分类 Technology 中的文章

Drawing Violin Plots with Seaborn

Introduction

A violin plot is used to display the distribution and probability density of multiple data groups. Similar to a box plot, it offers a better representation of data density. Violin plots are particularly useful when dealing with very large datasets that are difficult to display individually. Python’s Seaborn package makes it very convenient to create violin plots.

Parameters

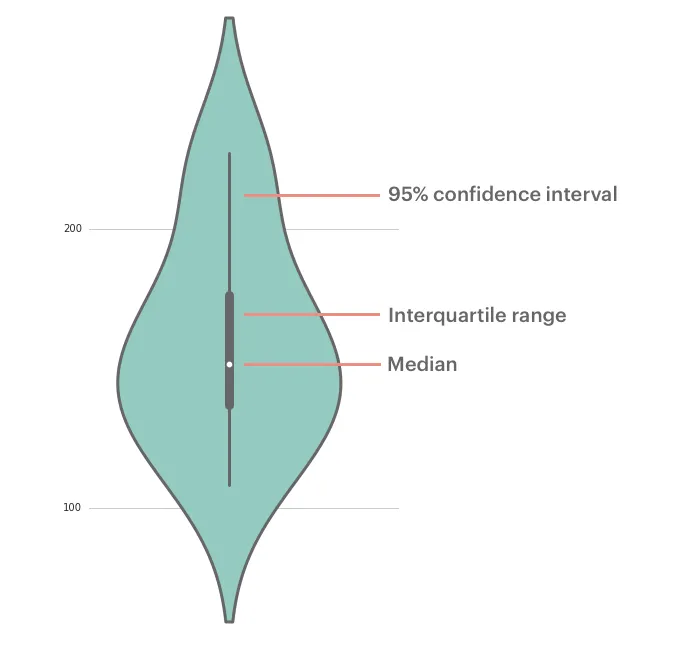
Drawing Violin Plots with Seaborn

The parameters corresponding to each position in a violin plot are shown above. The middle line represents the box plot data, specifically the 25th, 50th (median), and 75th percentiles. The thin lines indicate the 95% confidence interval.

Drawing Violin Plots with Seaborn

Single Variable Data

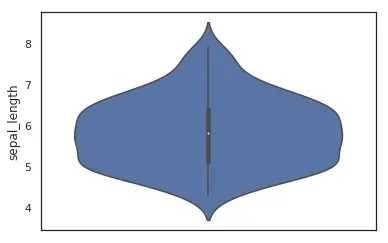
While a box plot would suffice for a single variable, a violin plot can certainly be used as well:

    import seaborn as sns
    sns.set(color_codes=True)
    sns.set_style("white")
    df = sns.load_dataset('iris')
    sns.violinplot( y=df["sepal_length"] )

Drawing Violin Plots with Seaborn

……

阅读全文

The difference between shadowcopy and deepcopy in python

In python, it is common to need to copy specific objects, and you might encounter various bugs because understanding the difference between these three operations is key: assignment, shallow copy, and deep copy.

“The difference between shadowcopy and deepcopy in python”

Assignment (=), shallow copy (copy), and deep copy (deepcopy) are relatively easy to distinguish regarding assignment vs. copying, but shallow copy and deep copy are harder to differentiate.

The assignment statement does not copy the object; it simply binds the variable to the object. Any change to one object will affect the other. Copying allows you to change one object without affecting the other.

The difference between shallow and deep copy is that shallow copy does not affect the other object when values change, but adding or deleting elements can affect it. Deep copy creates a completely independent object, and changes to one will not affect the other.

……

阅读全文

python3 requests module usage examples

The network module in python3 is much more convenient compared to python2. The requests package combines several python2 packages. This article explains the usage of requests with examples, serving as a review and future reference.……

阅读全文

Introduction to Artificial Neural Networks

Artificial Neural Network (ANN), also called Neural Network (NN) or neural-like network, is a mathematical model that mimics the structure and function of biological neural networks. It consists of a large number of neurons connected for computation. In most cases, artificial neural networks can change their internal structure based on external information, making them adaptive systems, simply put, they have learning capabilities.……

阅读全文

Recursively download files python

I want to back up my website recently, but the size of the file downloaded by PHP is limited, and I am too lazy to install FTP to download it. So I thought of temporarily setting up a secondary domain name site, and then using python (python3)’s requests library to directly download all the files and folders in the root directory of the website to achieve the purpose of backup.……

阅读全文

Python Converts All Site Images to WebP Format

WebP is an image file format developed by Google that provides both lossy and lossless compression. The WebP image format can significantly reduce file size while achieving the same image quality as the JPEG format, thereby significantly reducing the time it takes for image files to be sent over the network.……

阅读全文

Drawing the Butterfly Curve with Python

The butterfly curve, discovered by Temple H. Fay, is a beautiful curve that can be expressed using a polar coordinate function. Because of its elegance, I wanted to use it as my blog’s favicon.ico. Here, I’ll use Python’s matplotlib.pyplot package to draw the desired butterfly curve. First, let’s admire the beautiful butterfly curve.


butter

1. First, We Need to Define the Mathematical Expression of the Butterfly Curve

math

math2

It can also be expressed using spherical coordinates:

math3


2. Choosing matplotlib.pyplot as the Plotting Tool in Python

1. First, import the necessary Python packages

import numpy as np
import matplotlib.pyplot as plt

2. Set the parameter values

t = np.arange(0.0, 12*np.pi, 0.01)
x = np.sin(t)*(np.e**np.cos(t) - 2*np.cos(4*t)-np.sin(t/12)**5)
y = np.cos(t)*(np.e**np.cos(t) - 2*np.cos(4*t)-np.sin(t/12)**5)

3. According to the formula, use numpy functions with plt to draw the required image

plt.figure(figsize=(8,6))
plt.axis('off')
plt.plot(x,y,color='blue',linewidth = '2')
#plt.show()
plt.savefig("butter.jpg",dpi=400)

butter_fly

4. Use Pillow to resize the image to an appropriate size for a favicon

from PIL import Image
im = Image.open("butter.jpg")
favicon = im.resize((50,50))
favicon.save("favicon.ico")

image_ico

……

阅读全文