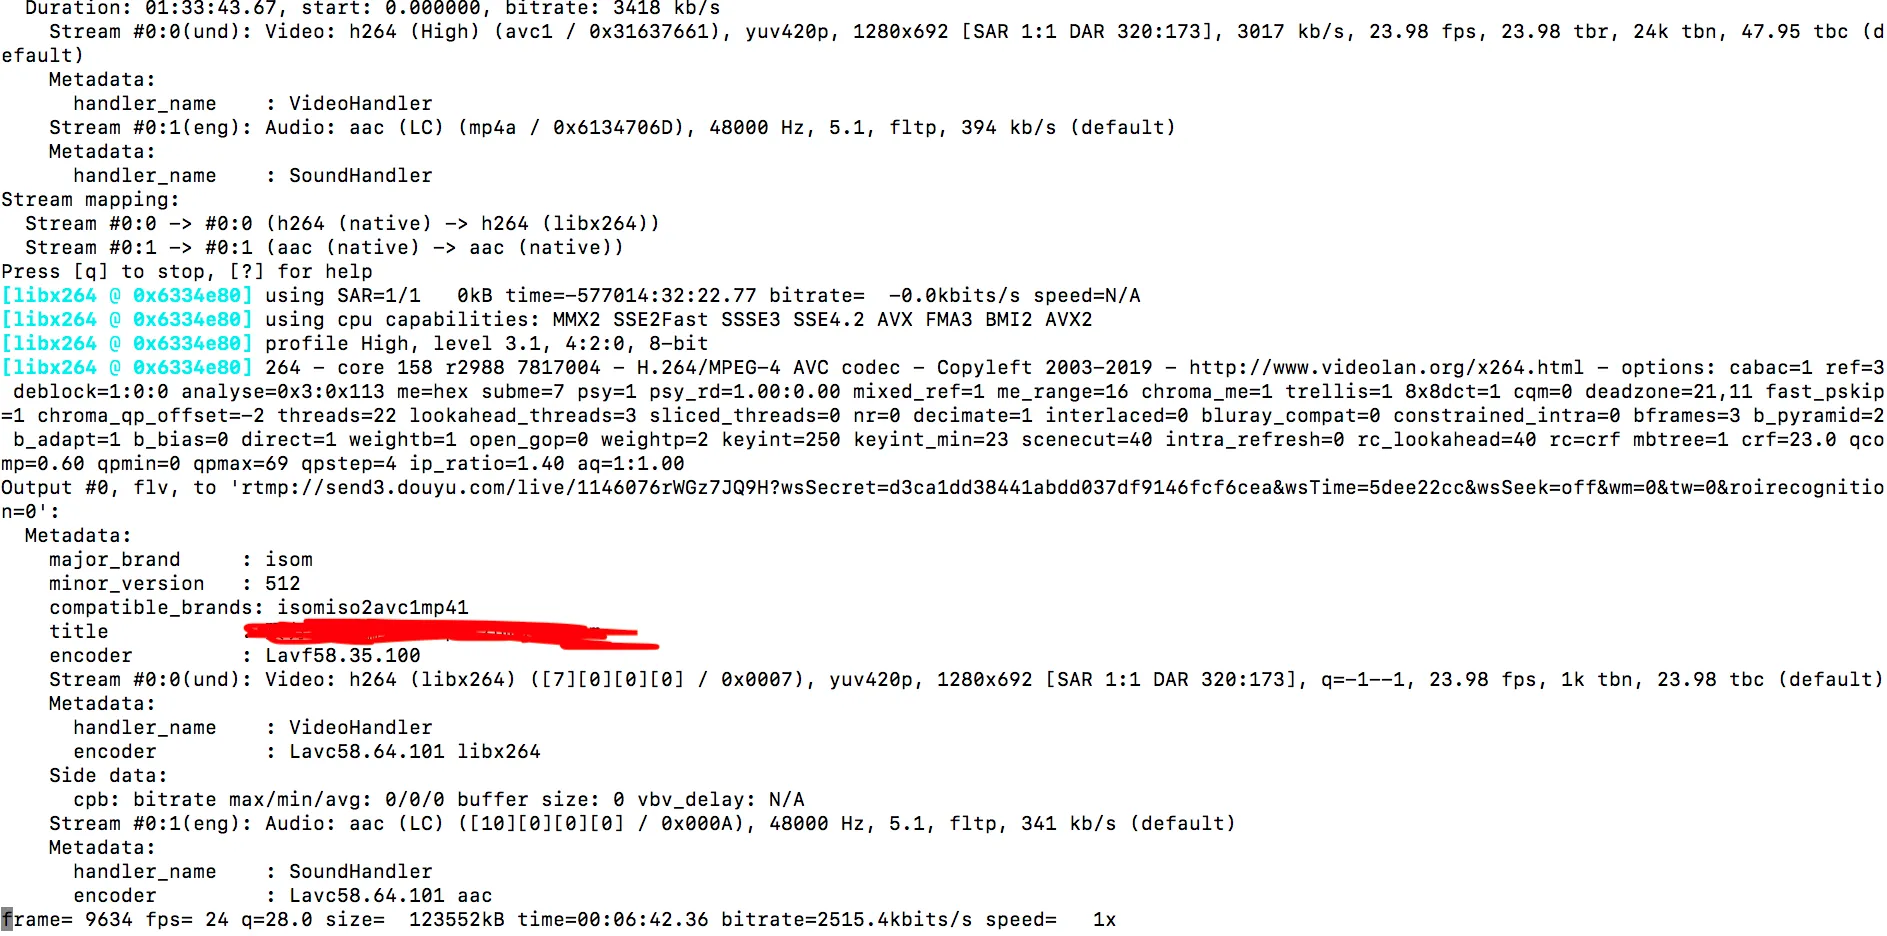
Getting back on track, today’s tutorial by Chunjiang Muker shows how to automatically stream Douyu live on CentOS 7 to achieve 24/7 uninterrupted streaming.……
阅读全文
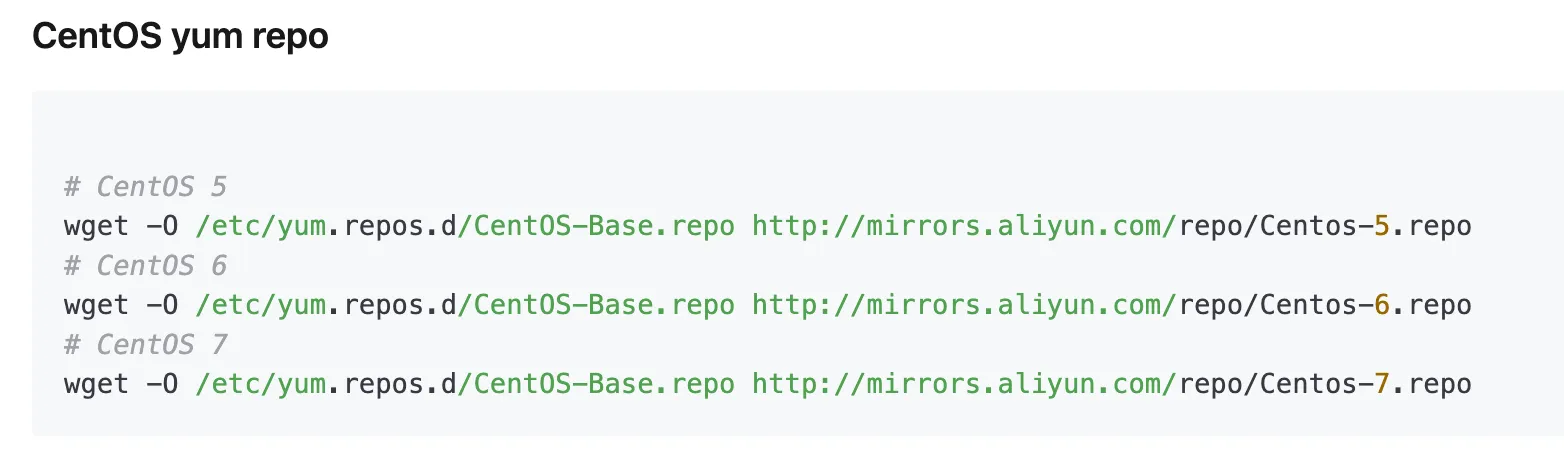
A few days ago on WeChat, I discovered that Tongji University actually has its own open source software mirror site. Our lab servers are still using Alibaba Cloud’s CentOS 7 mirror. Wouldn’t it be much faster if we switched to the university’s mirror? So how to change CentOS 7 public repo to Tongji University’s mirror?……
阅读全文
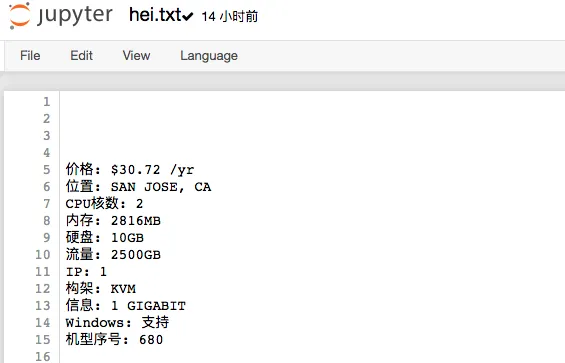
Virmach’s Black Friday machines appear and disappear rapidly. For hosting enthusiasts, constantly checking current VPS prices and deciding whether to buy is troublesome. This article lists Black Friday machine configurations using sklearn and predicts VPS prices with machine learning to alert users if prices are cheap.……
阅读全文
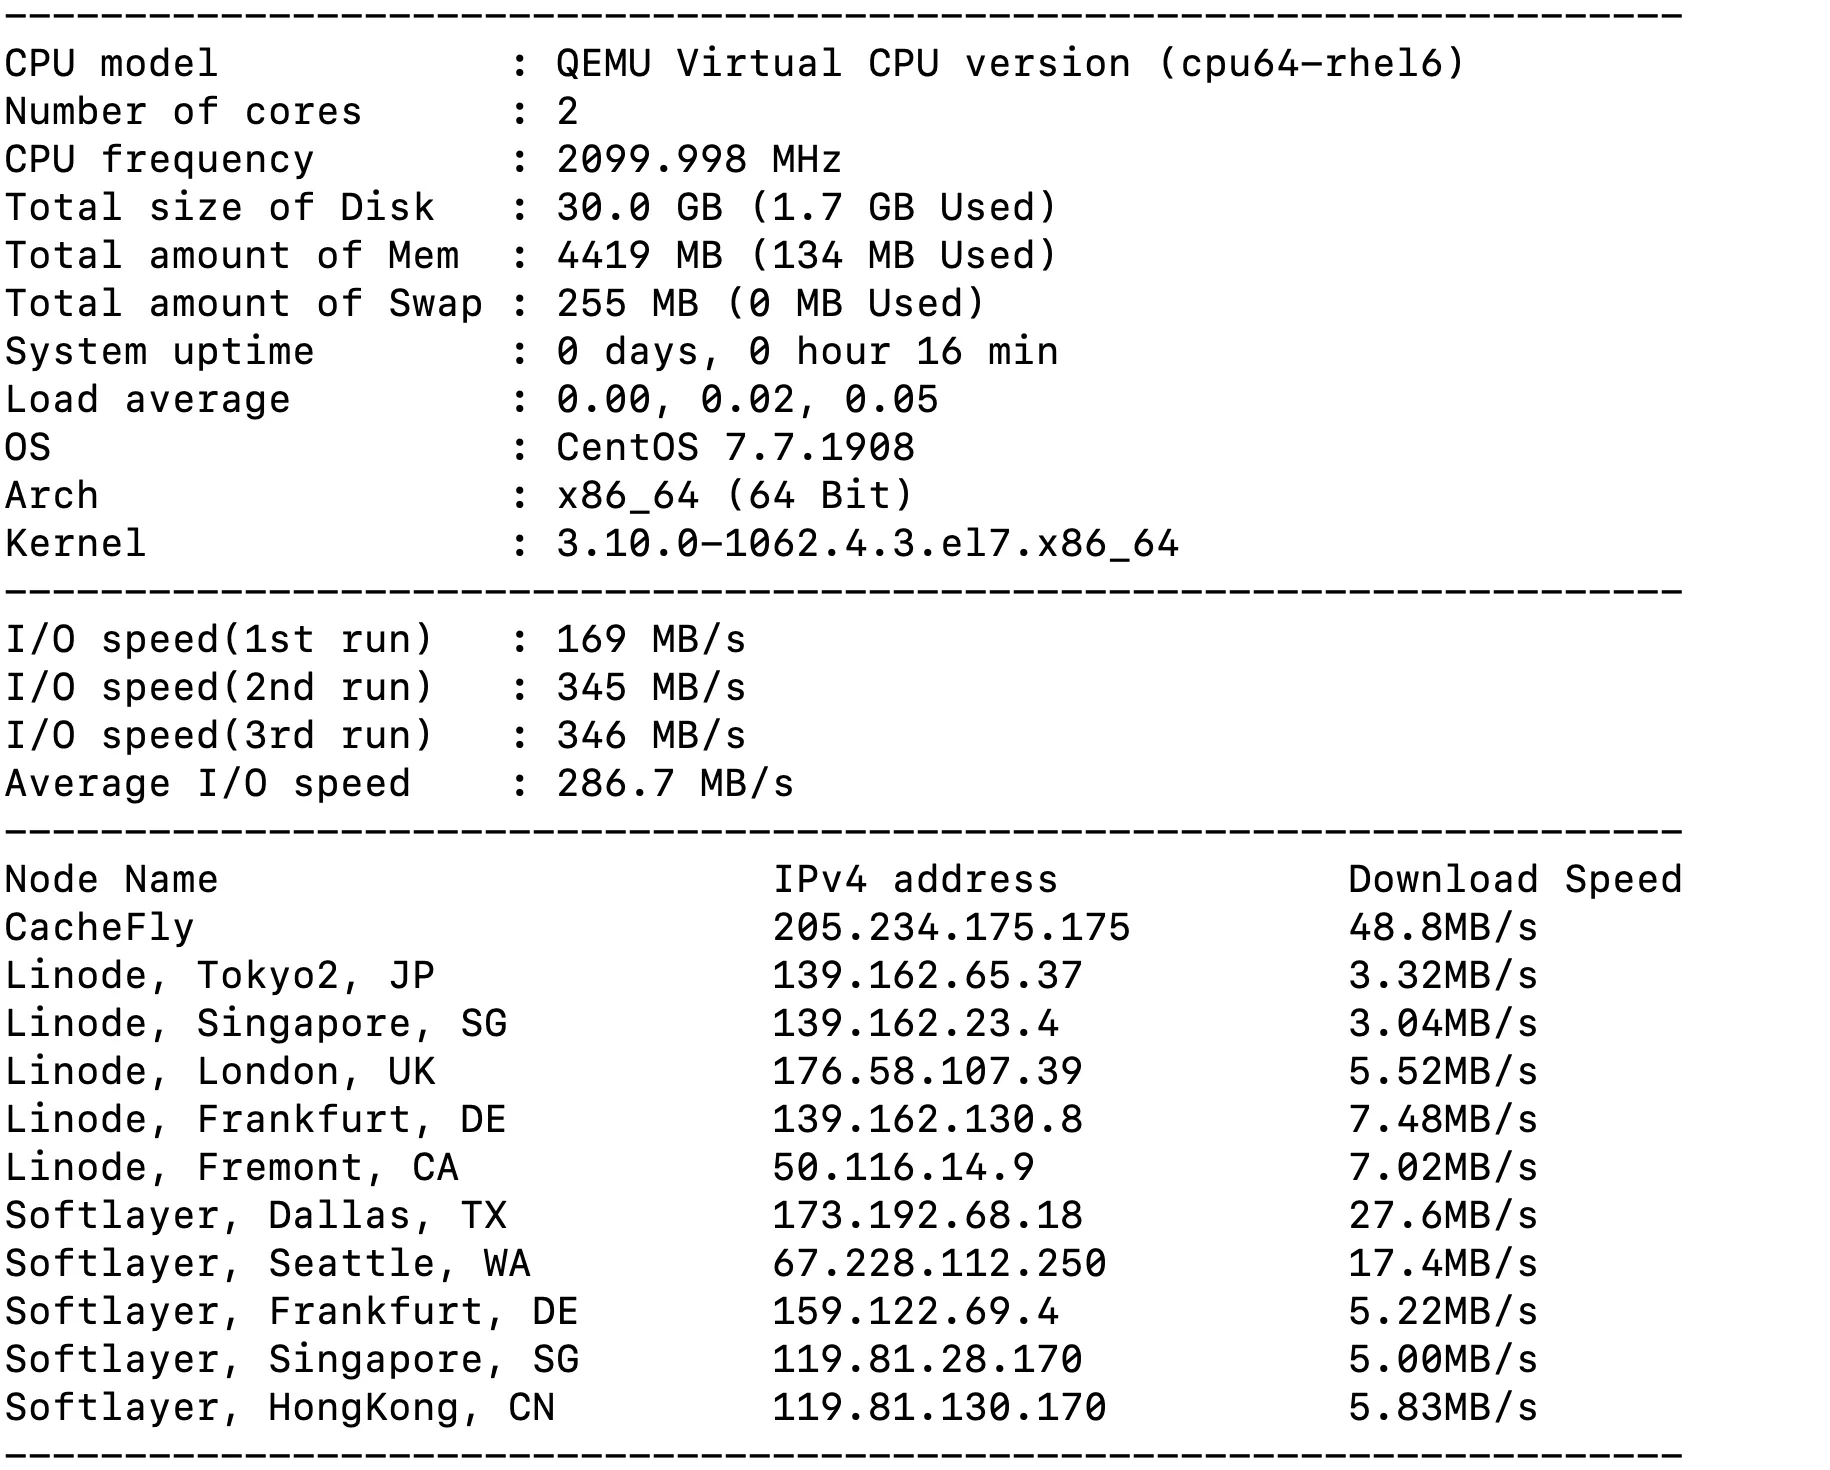
During the recent Black Friday sales, I grabbed a special machine from Virmach, so I thought of testing its performance by running some VPS performance and network tests since the machine looks pretty good.……
阅读全文
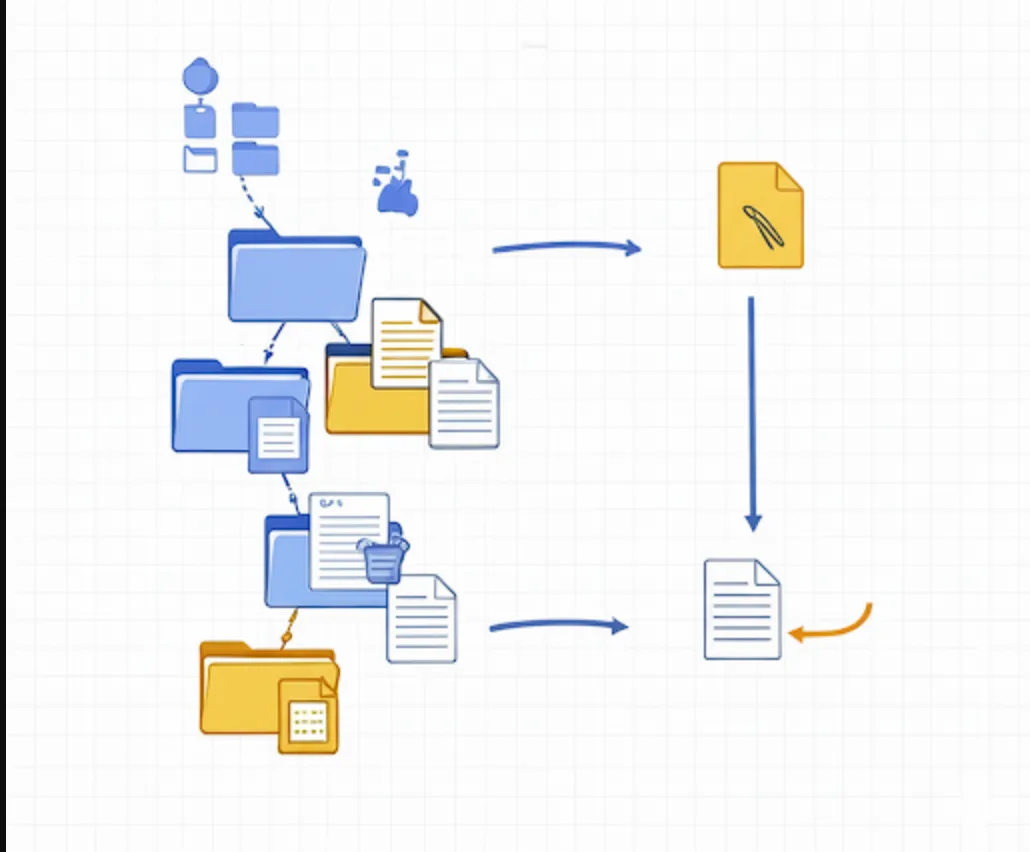
How to batch replace strings in Linux? At first, I thought about using sed with -r or some iterative method, but found sed doesn’t support iteration parameters. So, I use find to get files and sed to replace strings.……
阅读全文
During Linux system development, sometimes your program might crash or be stopped. To keep it running continuously, adding the program to the service list is a very good practice.……
阅读全文
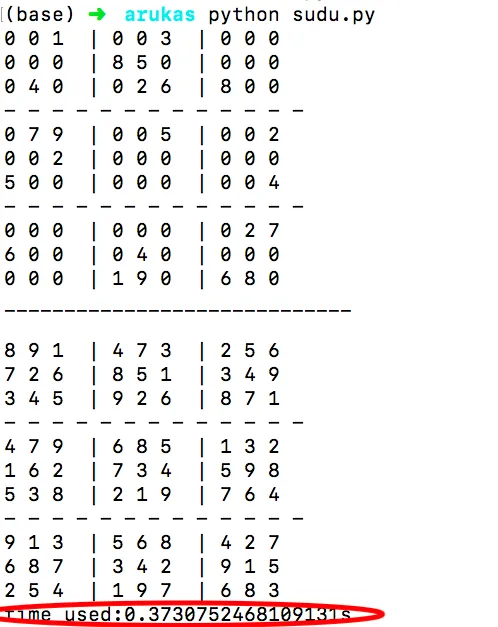
This article explains how to solve a 9x9 Sudoku puzzle in Python with backtracking, including board representation, empty-cell search, candidate filtering, validity checks, and recursive backtracking.……
阅读全文
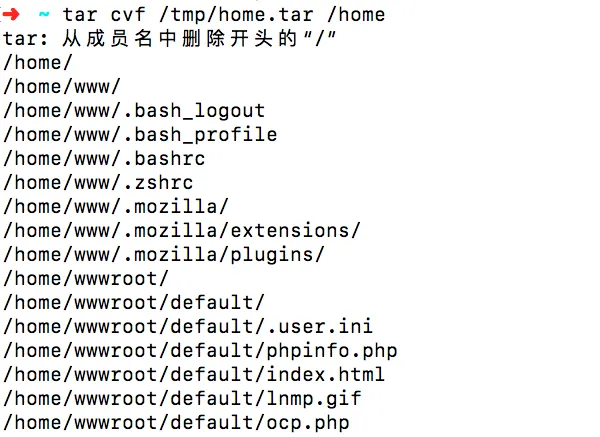
This guide shows how to shrink /home and grow /root on CentOS 8 with LVM, with practical notes on backup, filesystem expansion, and the final /etc/fstab check after recreating /home.……
阅读全文
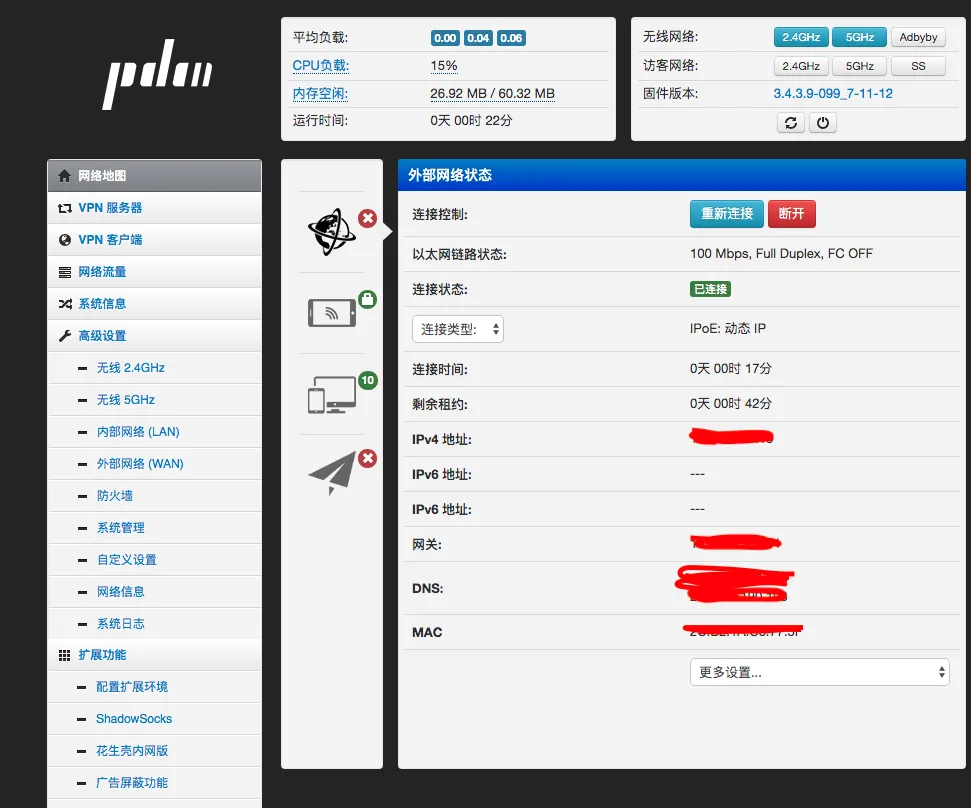
This guide shows how to enable IPv6 passthrough on a K2 router running Padavan firmware, including WAN IPv6 settings, the startup script, and quick checks on the client side.……
阅读全文
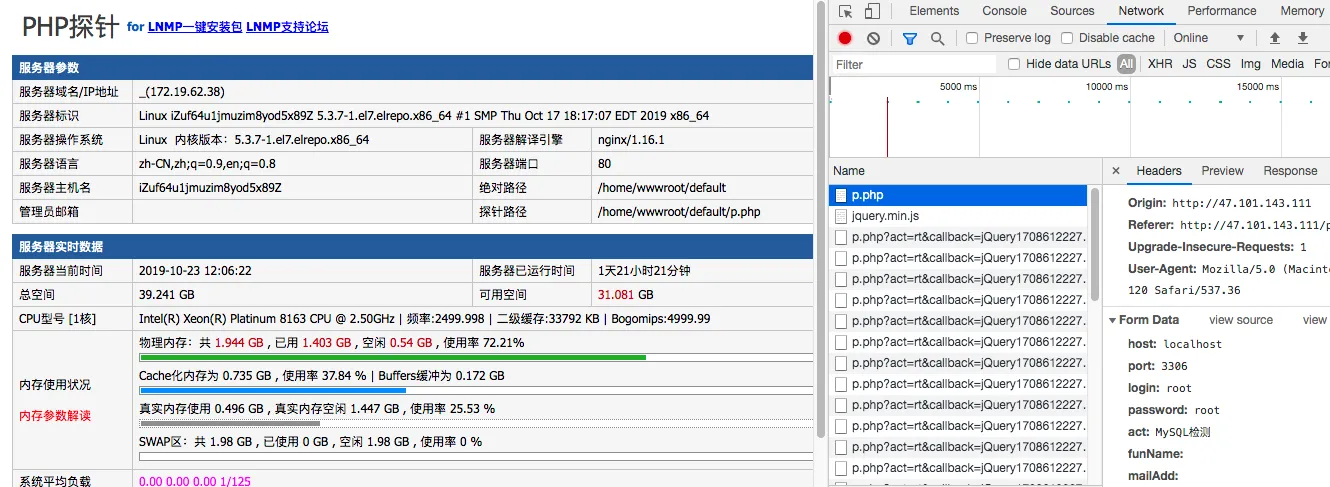
My blog used the lnmp program to build the web environment, but when I needed to use mysql, I found that the lnmp installation log file was missing and the mysql root password was forgotten. I remember that the lnmp was installed by pressing Enter all the way, and the default lnmp password is lnmp.org# plus 5 random numbers, with only 100,000 possibilities. In this case, brute-forcing 100,000 times will definitely find the password.……
阅读全文
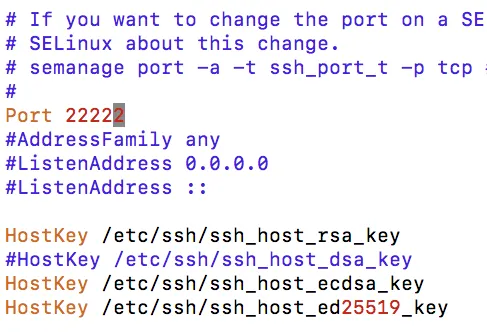
This guide shows how to move the real SSH service to a new port and deploy a Docker-based SSH honeypot on port 22 to collect brute-force logs for defensive analysis.……
阅读全文

This article collects 10 practical tips for Python data analysis and Jupyter Notebook workflows, including dataset profiling, interactive plotting, notebook magics, debugging, and a few time-saving shortcuts.……
阅读全文