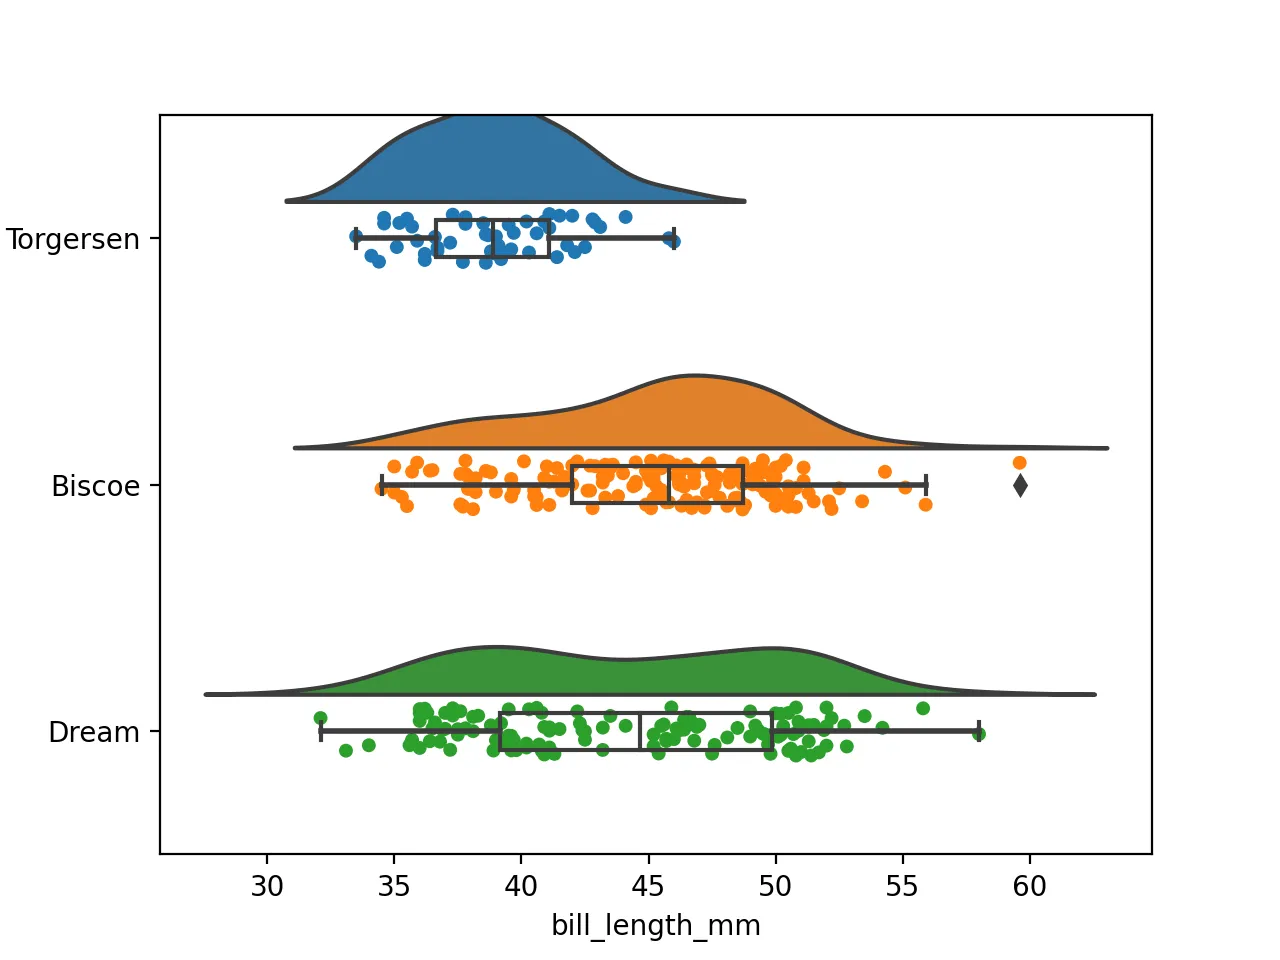
Drawing Raincloud Plots with Python
This guide shows how to create a Raincloud plot with Python, what the layered structure means, and what to adjust before exporting the figure for reports or papers.……
春江暮客的个人学习分享网站