Python Log Triage: Use rg and uv to Find Nginx 5xx Errors Fast
When a production service starts failing, the first useful step is usually not building a complex platform. It is answering three questions: when did the errors start, which URLs failed most often, and whether the failures are concentrated around specific clients or upstream services.
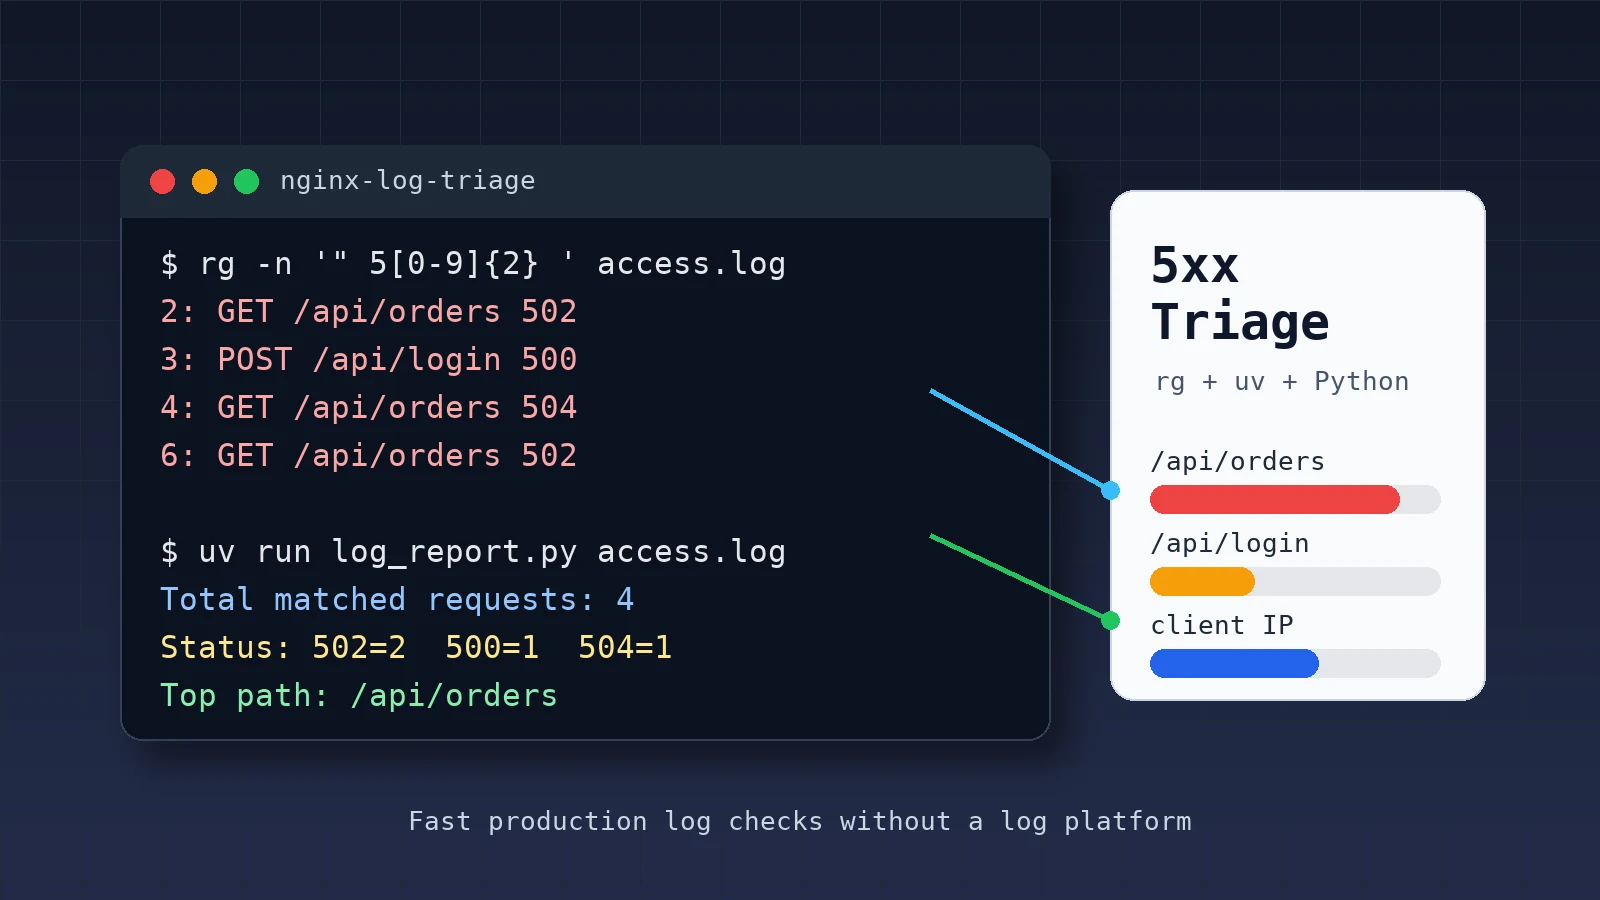
If the log is large, opening it in an editor is slow. A more practical workflow is to use rg to filter suspicious lines first, then use a small Python script for the summary. This tutorial uses Nginx access logs and builds a workflow you can copy to a server.
By the end, you will have:
- A set of useful
rgcommands for log searching - A Python analysis script that runs with
uv run - A 5xx summary grouped by status code, URL, and IP
- Direct fixes for common errors
When this workflow is useful
This method is useful for temporary troubleshooting and lightweight automation:
- Nginx, Apache, or application access logs are large
- You need to find
500,502,503, or504quickly - You do not have a full log platform yet, or the platform query is inconvenient
- You want to turn one-off troubleshooting commands into a repeatable script
If you already have ELK, Loki, or a cloud logging service, this workflow is still worth keeping. Local server triage is often more direct.
Method 1: Narrow the log with rg first
Create a test directory:
mkdir nginx-log-triage
cd nginx-log-triage
Write a small sample log:
cat > access.log <<'EOF'
203.0.113.10 - - [03/Jun/2026:07:40:01 +0800] "GET / HTTP/1.1" 200 612 "-" "curl/8.0"
203.0.113.11 - - [03/Jun/2026:07:40:03 +0800] "GET /api/orders HTTP/1.1" 502 173 "-" "Mozilla/5.0"
203.0.113.12 - - [03/Jun/2026:07:40:08 +0800] "POST /api/login HTTP/1.1" 500 91 "-" "Mozilla/5.0"
203.0.113.11 - - [03/Jun/2026:07:41:15 +0800] "GET /api/orders HTTP/1.1" 504 173 "-" "Mozilla/5.0"
203.0.113.13 - - [03/Jun/2026:07:42:20 +0800] "GET /assets/app.css HTTP/1.1" 200 2048 "-" "Mozilla/5.0"
203.0.113.14 - - [03/Jun/2026:07:43:11 +0800] "GET /api/orders HTTP/1.1" 502 173 "-" "Mozilla/5.0"
EOF
Find all 5xx lines:
rg -n '" 5[0-9]{2} ' access.log
Only show 502 and 504:
rg -n '" (502|504) ' access.log
Show one line of context before and after each match:
rg -n -C 1 '" 5[0-9]{2} ' access.log
If logs are split across multiple files:
rg -n '" 5[0-9]{2} ' /var/log/nginx -g '*.log'
The goal of this step is not the final report. It is to quickly confirm whether the errors exist, where they are concentrated, and whether deeper counting is needed.
Method 2: Run a Python summary script with uv
rg is great for fast filtering. If you need to count the busiest URLs and client IPs, Python is more reliable.
Create a script:
uv init --script log_report.py --python 3.12
Replace log_report.py with this:
# /// script
# requires-python = ">=3.12"
# ///

from __future__ import annotations

import argparse
import re
from collections import Counter
from pathlib import Path


LOG_PATTERN = re.compile(
    r'(?P<ip>\S+) \S+ \S+ \[(?P<time>[^\]]+)\] '
    r'"(?P<method>\S+) (?P<path>\S+) [^"]+" '
    r'(?P<status>\d{3}) (?P<size>\S+)'
)


def iter_records(path: Path):
    with path.open(encoding="utf-8", errors="replace") as file:
        for line_number, line in enumerate(file, start=1):
            match = LOG_PATTERN.search(line)
            if not match:
                continue
            record = match.groupdict()
            record["line"] = str(line_number)
            yield record


def main() -> None:
    parser = argparse.ArgumentParser(description="Summarize Nginx 5xx access log entries.")
    parser.add_argument("log_file", type=Path)
    parser.add_argument("--status", default="5", help="Status prefix, for example 5 or 50")
    parser.add_argument("--top", type=int, default=5)
    args = parser.parse_args()

    status_count: Counter[str] = Counter()
    path_count: Counter[str] = Counter()
    ip_count: Counter[str] = Counter()
    first_seen: str | None = None
    last_seen: str | None = None

    for record in iter_records(args.log_file):
        status = record["status"]
        if not status.startswith(args.status):
            continue

        status_count[status] += 1
        path_count[record["path"]] += 1
        ip_count[record["ip"]] += 1
        first_seen = first_seen or record["time"]
        last_seen = record["time"]

    total = sum(status_count.values())
    print(f"Total matched requests: {total}")
    print(f"Time range: {first_seen or 'n/a'} -> {last_seen or 'n/a'}")

    print("\nStatus:")
    for status, count in status_count.most_common():
        print(f"  {status}: {count}")

    print("\nTop paths:")
    for path, count in path_count.most_common(args.top):
        print(f"  {count:>4}  {path}")

    print("\nTop client IPs:")
    for ip, count in ip_count.most_common(args.top):
        print(f"  {count:>4}  {ip}")


if __name__ == "__main__":
    main()
Run it:
uv run log_report.py access.log
Validate the output
Expected output should look like this:
Total matched requests: 4
Time range: 03/Jun/2026:07:40:03 +0800 -> 03/Jun/2026:07:43:11 +0800

Status:
  502: 2
  500: 1
  504: 1

Top paths:
     3  /api/orders
     1  /api/login

Top client IPs:
     2  203.0.113.11
     1  203.0.113.12
     1  203.0.113.14
This already gives you useful next steps:
/api/ordersis the most concentrated failing URL502appears more often than500, so upstream health or reverse proxy behavior should be checked first- The failures happened between
07:40and07:43, so you can compare that range with application logs and deployment time
Method 3: Use it with real server logs
On a server, copy the script and run it against the real log:
uv run log_report.py /var/log/nginx/access.log
Only count 502:
uv run log_report.py /var/log/nginx/access.log --status 502
Show a larger ranking:
uv run log_report.py /var/log/nginx/access.log --top 20
If you only want to analyze recently appended lines, create a temporary file first:
tail -n 20000 /var/log/nginx/access.log > recent-access.log
uv run log_report.py recent-access.log
This avoids repeatedly scanning the full log and makes incident triage faster.
Troubleshooting flow
After you have the summary, continue in this order:
- Many
500responses: check application error logs, stack traces, and database connection errors - Many
502responses: check whether the upstream service is alive, whether the port is correct, and whether reverse proxy timeouts are involved - Many
503responses: check rate limits, maintenance mode, and whether the service pool has available instances - Many
504responses: check slow queries, external APIs, upstream response time, and Nginx timeout settings
For example, check the Nginx error log first:
rg -n "upstream|timeout|connect\\(\\) failed|refused" /var/log/nginx/error.log
Then check the same time range in the application log:
rg -n "07:4[0-3]|ERROR|Traceback|Exception" /path/to/app.log
Common errors
1. rg does not find any 5xx lines
First confirm whether your log format has spaces around the status code. The commands in this article match this part of the Nginx combined log format:
"GET /api/orders HTTP/1.1" 502 173
If your log is JSON, search the JSON field directly:
rg -n '"status":50[0-9]' access.jsonl
2. The Python script returns 0
The usual cause is a log format mismatch. Print one real line first:
head -n 1 access.log
If the field order differs from the sample, adjust LOG_PATTERN. During an incident, you can also use rg and awk first instead of building a universal parser immediately.
3. Permission is denied when reading logs
If the current user cannot read /var/log/nginx/access.log, check permissions:
ls -l /var/log/nginx/access.log
For temporary troubleshooting:
sudo tail -n 20000 /var/log/nginx/access.log > recent-access.log
sudo chown "$USER":"$USER" recent-access.log
uv run log_report.py recent-access.log
4. Logs are compressed
rg does not search .gz content directly by default. First confirm with zgrep:
zgrep -n '" 5[0-9][0-9] ' /var/log/nginx/access.log.1.gz | head
If you need the Python summary, decompress to a temporary file first:
gzip -dc /var/log/nginx/access.log.1.gz > old-access.log
uv run log_report.py old-access.log
Summary
Log triage does not always need a complex platform first. rg quickly finds suspicious lines in large files, Python turns those clues into status, URL, and IP rankings, and uv makes the script easy to run on a new machine.
This workflow is useful for temporary server incidents and for small internal tools. The next time you see a 5xx spike, use these commands to narrow the problem before deciding whether to inspect the application, database, or upstream service.
- 原文作者:春江暮客
- 原文链接:https://www.bobobk.com/en/python-log-triage-rg-uv.html
- 版权声明:本作品采用 知识共享署名-非商业性使用-禁止演绎 4.0 国际许可协议 进行许可,非商业转载请注明出处(作者,原文链接),商业转载请联系作者获得授权。
相关文章
- rg Tutorial: Why Many Developers Use ripgrep Instead of grep
- Write Self-Contained Python Scripts with uv and PEP 723
- 2026 Practical Python Workflow: Replace pip, venv, and pipx with uv
- Automatically Publishing Articles to WordPress Using a Python Script: A Complete Workflow Analysis
- Four Plotting Tips in Python