分类 Technology 中的文章

Python Data Visualization - The Post-2000 Gaokao Generation

The post-2000 generation has finished their Gaokao (National College Entrance Examination), and there’s been extensive media coverage (they are the “fresh meat” generation, after all!). Many reports focused on this year’s examinee data, presenting it with stunning charts. Feeling a bit jealous about how beautiful those charts are? Do you want to try making one yourself? These charts are actually products of data visualization created with Python, so yes, you can definitely make them yourself!


Preparation

  1. Libraries

    • charts
    • pyecharts
  2. Data

    • Collected directly from Baidu.

Common Chart Types

Bar charts and line charts are frequently seen and used, so let’s start with the basics.

1. Bar Chart

# Number of Gaokao examinees
gaokao_num = [940,940,...,375]
gaokao_num.reverse()
# Number of admitted students
luqu_num = [700,705,...,221]
luqu_num.reverse()
# Admission rate
luqu_lev= [74.46,75,...,59]
luqu_lev.reverse()

import charts

options = {
    'chart'   : {'zoomType':'xy'},
    # Title
    'title'   : {'text': '2000-2017 Gaokao Data'},
    # Subtitle
    'subtitle': {'text': 'Source: edu.sina.com.cn'},
    # X-axis
    'xAxis'   : {'categories': ['2000',...,'2017']},
    # Y-axis
    'yAxis'   : {'title': {'text': 'Million people/year'}},
    }
series =  [{
    'type': 'column',
    'name': 'Number of Gaokao Examinees',
    'data': gaokao_num
},{
    'type': 'column',
    'name': 'Number of Admitted Students',
    'data': luqu_num
}
]
charts.plot(series, options=options, show='inline')

Due to a minor issue with my pyecharts setup, I used the charts library. Using pyecharts is even simpler, but I won’t repeat it here. You can check the source code if needed.

……

阅读全文

Parallelism in One Line of Python Code

Python has a somewhat notorious reputation when it comes to program parallelization. Technical issues aside, such as thread implementation and the GIL, I believe incorrect teaching guidance is the main problem. Common classic Python multithreading and multiprocessing tutorials often seem “heavy” and tend to scratch the surface without deeply exploring the most useful content for daily work.……

阅读全文

Python Implementation of Classic Sorting Algorithms (1)

In computer science, a sorting algorithm is an algorithm that arranges a list of data in a specific order. The most commonly used sorting methods are numerical order and lexicographical (dictionary) order. Efficient sorting algorithms are crucial in various other algorithms. Sorting algorithms are also used in processing text data and generating human-readable output.

Basically, the output of a sorting algorithm must adhere to the following two principles:

  1. The output result is an increasing sequence (increasing refers to the desired sort order).
  2. The output result is a permutation or rearrangement of the original input.

The 10 classic sorting algorithms can be divided into two main categories:

Non-linear time comparison-based sorting: These algorithms determine the relative order of elements by comparing them. Since their time complexity cannot break through $O(n log n)$, they are called non-linear time comparison-based sorting algorithms.

Linear time non-comparison-based sorting: These algorithms do not determine the relative order of elements by comparison. They can break through the lower bound of comparison-based sorting and run in linear time, hence they are called linear time non-comparison-based sorting algorithms.

……

阅读全文

Detailed Examples of Seaborn Plotting Kernel Density Curves

In a frequency distribution histogram, when the sample size is sufficiently enlarged to its limit, and the bin width is infinitely shortened, the step-like broken line in the frequency histogram will evolve into a smooth curve. This curve is called the density distribution curve of the population.

In this article, Chunjing Muke will detail how to use the Python plotting library Seaborn and the Iris flower dataset from Pandas to plot various cool density curves.


1. Basic Density Curve

    import seaborn as sns
    sns.set(color_codes=True)
    sns.set_style("white")
    df = pd.read_csv('iris.csv')
    sns.kdeplot(df['sepal_width'])

‘Detailed Examples of Seaborn Plotting Kernel Density Curves’

To plot a kernel density curve using Seaborn, you only need to use kdeplot. Note that a density curve only requires one variable; here we choose the sepal_width column.


2. Density Curve with Shading

    import seaborn as sns
    sns.set(color_codes=True)
    sns.set_style("white")
    df = pd.read_csv('iris.csv')
    sns.kdeplot(df['sepal_width'],shade=True)

‘Detailed Examples of Seaborn Plotting Kernel Density Curves’

……

阅读全文

Drawing a Stunning "Dream of the Red Chamber" Word Cloud with Python 3

Word clouds, which I’m sure you’ve all seen, are created using wordcloud, a famous Python library. This article will detail how to use wordcloud to create a word cloud for “Dream of the Red Chamber,” one of China’s Four Great Classical Novels.


1. Preparation

This involves three parts:

2. The wordcloud and jieba libraries, which can be installed using pip install wordcloud and pip install jieba.

3. Preparing a Chinese font file.

The .txt text file and font file are bundled together for your convenience to replicate this tutorial’s example.


2. Drawing the “Dream of the Red Chamber” Word Cloud

Here’s the code directly:

    from wordcloud import WordCloud
    import jieba
    text = "".join(jieba.cut(open("红楼梦.txt").read()))
    wordcloud = WordCloud(font_path="kaibold.ttf").generate(text)

    # Display the generated image:
    plt.imshow(wordcloud, interpolation='bilinear')
    plt.axis("off")
    plt.margins(x=0, y=0)
    plt.show()

《Drawing a Stunning “Dream of the Red Chamber” Word Cloud with Python 3》

……

阅读全文

TypeError: ufunc 'isnan' not supported for the input types - Solution

Today, while using Python’s Seaborn to plot a heatmap (clustermap), I kept encountering this error. My data seemed perfectly fine, and a Google search didn’t yield any good solutions. After some exploration, I’m sharing the final solution here.


1. Generating the DataFrame

    import pandas as pd
    import numpy as np
    import matplotlib.pyplot as plt
    from seaborn import clustermap
    import seaborn as sns; sns.set(color_codes=True)
    df = pd.DataFrame([["a","b","c","d","e","f"],[1,2,3,4,5,6],[2,3,4,5,6,7],[3,4,5,6,7,8]],  columns=list('ABCDEF')).T
    df
    g = sns.clustermap(df.iloc[:,1:],cmap="PiYG")

After generating and transposing the DataFrame, a TypeError occurs: TypeError: ufunc 'isnan' not supported for the input types, and the inputs could not be safely coerced to any supported types according to the casting rule "safe".

《TypeError: ufunc ‘isnan’ not supported for the input types solution》


2. Cause of the Error

This type of error arises because the DataFrame has been transposed, and the original DataFrame contained string columns. Just like in the example above, the first column contains strings (values ‘abcdef’). When transposed, all numerical values in the DataFrame are also converted to object types instead of float or int numerical types. Therefore, trying to plot a heatmap with character types naturally leads to an error.

……

阅读全文

TypeError: ufunc 'isnan' not supported for the input types - Solution

After generating and transposing the DataFrame, a TypeError occurred: TypeError: ufunc ‘isnan’ not supported for the input types, and the inputs could not be safely coerced to any supported types according to the casting rule “safe”.

《TypeError: ufunc ‘isnan’ not supported for the input types - Solution》

2. Cause of the Error

This type of error occurs because the DataFrame has been transposed, and the original DataFrame contains a column with strings. Just like in the example above, the first column contains string values “abcdef”. After transposition, all numbers in the DataFrame also become “object” type instead of “float” or “int” numeric types. Therefore, when we try to plot a heatmap with character types, an error naturally occurs.

If the DataFrame originally contained only numeric types, there would be no issue here.

3. Solution

Knowing the cause, the solution is simple: convert the corresponding numeric columns in the transposed DataFrame to numeric types. Here’s the code:

……

阅读全文

Python Implementation for Kugou Music MP3 Download

After implementing python for Qianqian Music mp3 download, some users found that many songs couldn’t be searched on Qianqian Music. So today, Chunjian Muke extended the download functionality to Kugou Music, with source code provided.

Using the same approach, first search for a song directly on the Kugou official website. Then, open the network monitor in Google Chrome and search for the same keyword again. You’ll then be able to find the API information (Note: It’s best to view the network requests during the second search to filter out unnecessary information).


1. Analyzing Search API Information

《Python Implementation for Kugou Music MP3 Download》 
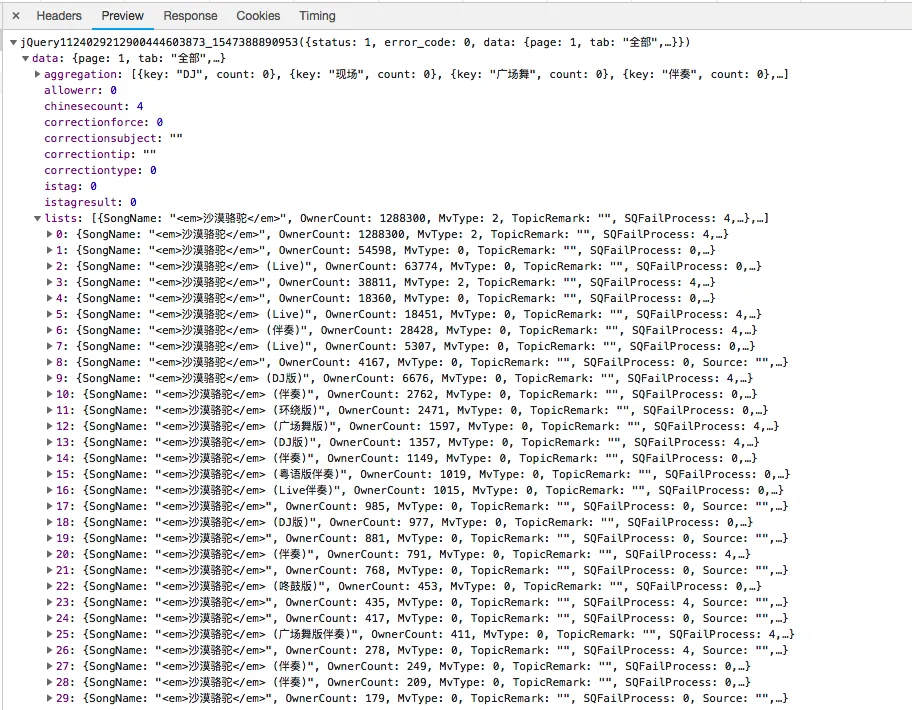
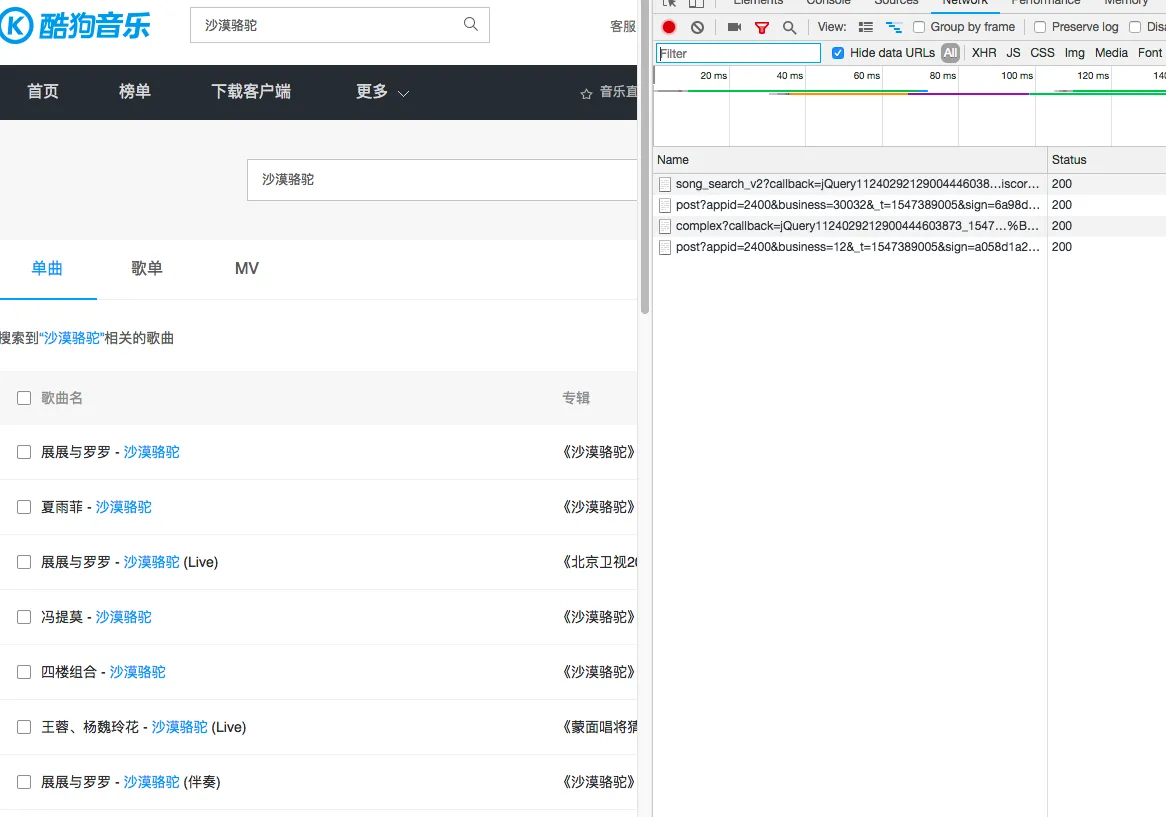
With only 4 network requests, it’s easy to identify that the first request genuinely returns song information, so we can construct this request.

《Python Implementation for Kugou Music MP3 Download》

……

阅读全文