python查找两个数组公有值
Python3 Binary Number Representation and Bitwise Operations
In information theory, the Hamming distance between two equally long strings is the number of positions at which the corresponding characters are different. In other words, it’s the minimum number of substitutions required to transform one string into the other. If the strings are binary, the Hamming distance can be calculated very simply using a bitwise XOR operation.
Here, we will introduce how to use binary representation and perform bitwise operations in Python 3.
Binary Representation in Python
In Python, binary numbers can be represented by strings prefixed with "0b" or "-0b". We can also use the bin() function to convert a numerical value into its binary string form.
    print(0b1101)
    #13
    print(0b11111110)
    #254
    bin(5)
    #'0b101'
Binary Bitwise Operations
Python provides the following bitwise operations:
>>: Right shift<<: Left shift|: Bitwise OR&: Bitwise AND^: Bitwise XOR~: Bitwise NOT
Let’s look at them in detail below.
……Python3二进制数值表示和位操作
在信息论中,两个等长字符串之间的汉明距离是两个字符串对应位置的不同字符的个数。换句话说,它就是将一个字符串变换成另外一个字符串所需要替换的字符个数,如果字符串是二进制的话,使用位运算异或可以非常简单的算出两字符串的汉明距离。
这里我们将介绍python3中如何使用二进制的使用以及二进制的位操作。
……Python Implementation of Classic Sorting Algorithms (1)
In computer science, a sorting algorithm is an algorithm that arranges a list of data in a specific order. The most commonly used sorting methods are numerical order and lexicographical (dictionary) order. Efficient sorting algorithms are crucial in various other algorithms. Sorting algorithms are also used in processing text data and generating human-readable output.
Basically, the output of a sorting algorithm must adhere to the following two principles:
- The output result is an increasing sequence (increasing refers to the desired sort order).
- The output result is a permutation or rearrangement of the original input.
The 10 classic sorting algorithms can be divided into two main categories:
Non-linear time comparison-based sorting: These algorithms determine the relative order of elements by comparing them. Since their time complexity cannot break through $O(n log n)$, they are called non-linear time comparison-based sorting algorithms.
Linear time non-comparison-based sorting: These algorithms do not determine the relative order of elements by comparison. They can break through the lower bound of comparison-based sorting and run in linear time, hence they are called linear time non-comparison-based sorting algorithms.
……Python实现经典排序算法(1)
在计算科学中,一个排序算法是一种能将一串数据依照特定排序方式进行排列的一种算法。最常用到的排序方式是数值顺序以及字典顺序。有效的排序算法在一些算法中是重要的。排序算法也用在处理文字数据以及产生人类可读的输出结果。
基本上,排序算法的输出必须遵守下列两个原则:1. 输出结果为递增序列(递增是针对所需的排序顺序而言) 2.输出结果是原输入的一种排列、或是重组
……Faceswap Training Resource Acquisition and Processing
faceswap训练资源获取与处理
Detailed Examples of Seaborn Plotting Kernel Density Curves
In a frequency distribution histogram, when the sample size is sufficiently enlarged to its limit, and the bin width is infinitely shortened, the step-like broken line in the frequency histogram will evolve into a smooth curve. This curve is called the density distribution curve of the population.
In this article, Chunjing Muke will detail how to use the Python plotting library Seaborn and the Iris flower dataset from Pandas to plot various cool density curves.
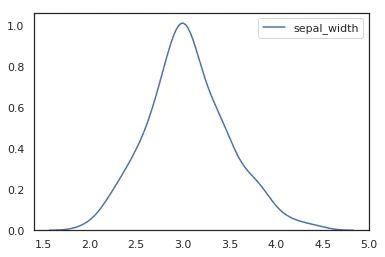
1. Basic Density Curve
    import seaborn as sns
    sns.set(color_codes=True)
    sns.set_style("white")
    df = pd.read_csv('iris.csv')
    sns.kdeplot(df['sepal_width'])

To plot a kernel density curve using Seaborn, you only need to use kdeplot. Note that a density curve only requires one variable; here we choose the sepal_width column.
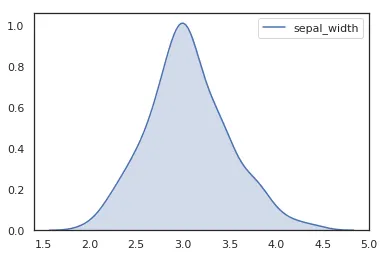
2. Density Curve with Shading
    import seaborn as sns
    sns.set(color_codes=True)
    sns.set_style("white")
    df = pd.read_csv('iris.csv')
    sns.kdeplot(df['sepal_width'],shade=True)

Seaborn绘制核密度曲线实例详解
在频率分布直方图中,当样本容量充分放大到极限时,组距极限缩短,这个时候频率直方图中的阶梯折线就会演变成一条光滑的曲线,这条曲线就称为总体的密度分布曲线。
这篇文章春江暮客将详细介绍如何使用python绘图库seaborn和panda里面的iris也就是鸢尾花卉数据集来绘制各种炫酷的密度曲线。
……