10 Tips to Improve Your Python Data Analysis Skills

In programming, even small tips or tools can make a big difference.
For example, a shortcut key or a helpful package might simplify a lot of work and double your efficiency.
Here I’ll share a few small tricks I often use.
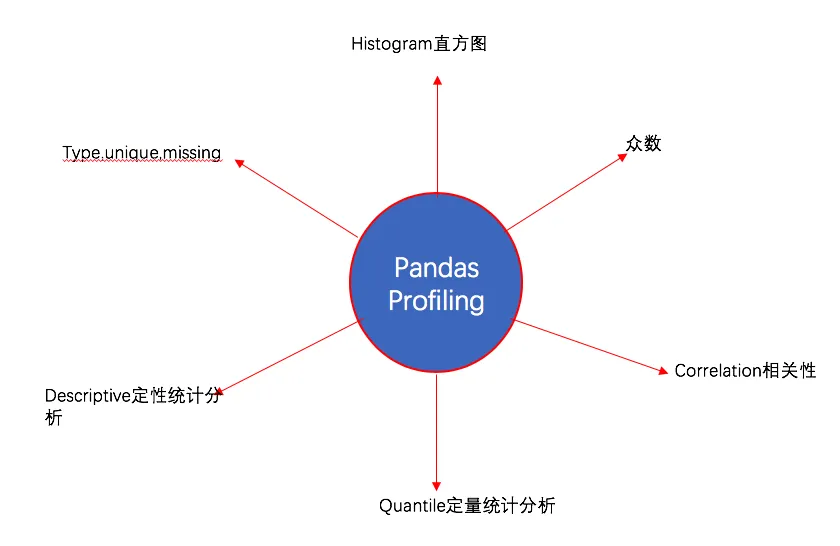
1. Use pandas_profiling to Inspect DataFrames
Understanding your data is essential before doing any analysis.
Although df.describe() and df.info() provide basic summaries, they’re limited for larger or more complex datasets.
The older pandas-profiling project is now distributed as ydata-profiling, and it still provides a quick way to generate a detailed report.
Installation
pip install ydata-profiling
# or
conda install -c conda-forge ydata-profiling
Usage
It’s very easy to use:
import pandas as pd
from ydata_profiling import ProfileReport

df = pd.read_csv("train.csv")
profile = ProfileReport(df, title="Titanic Profiling Report")
profile.to_notebook_iframe()
You can also export the report to HTML:
profile.to_file(output_file="titanic_Profiling_Report.html")
2. Interactive Plotting with cufflinks
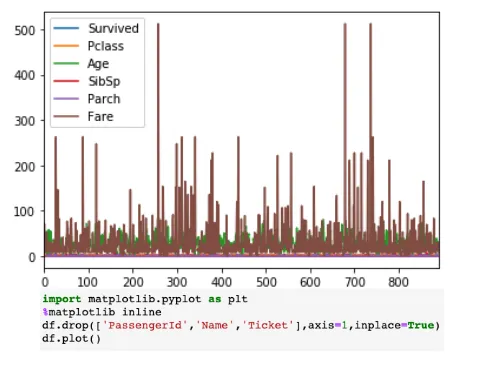
Pandas has built-in plotting via .plot(), but it’s not interactive.
If you want interactivity, try the cufflinks package.
Installation
pip install plotly   # dependency
pip install cufflinks
Usage
import pandas as pd
import cufflinks as cf
import plotly.offline

cf.go_offline()
cf.set_config_file(offline=False, world_readable=True)

df = pd.read_csv("train.csv")
df.iplot()
Left: Interactive chart by cufflinks
Right: Static chart by Pandas .plot()
3. Use Jupyter “Magic” Functions
Jupyter has many built-in “magic functions” that help with analysis.
You can list them all using:
%lsmagic
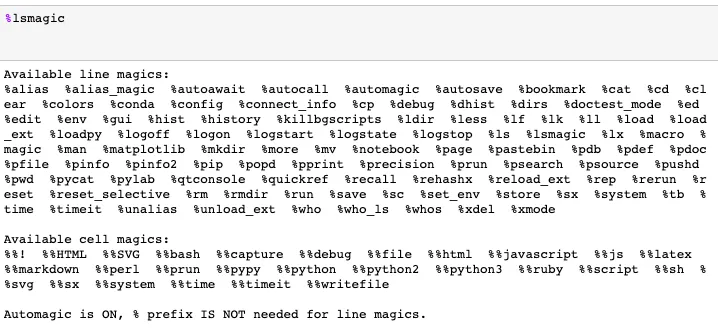
There are two kinds:
- Line magic: starts with
% - Cell magic: starts with
%%
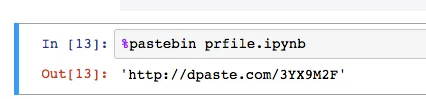
%pastebin
Uploads your code to Pastebin for sharing.
Example:
%pastebin prfile.ipynb
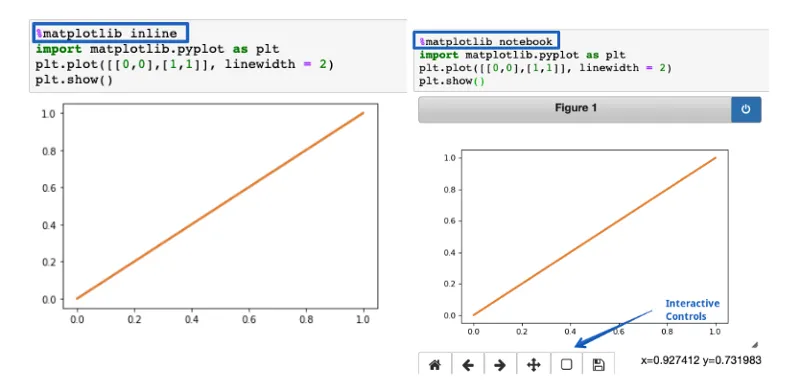
%matplotlib notebook
%matplotlib inline: static plots%matplotlib notebook: interactive plots in Jupyter
%run
Runs a Python script directly from the notebook.
%run file.py
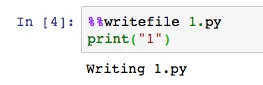
%%writefile
Writes everything in the current cell into a file.
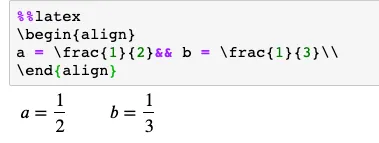
%%latex
For rendering math formulas.
4. Debugging with %debug
This magic function is great for troubleshooting errors.
Use q to quit the debug console.
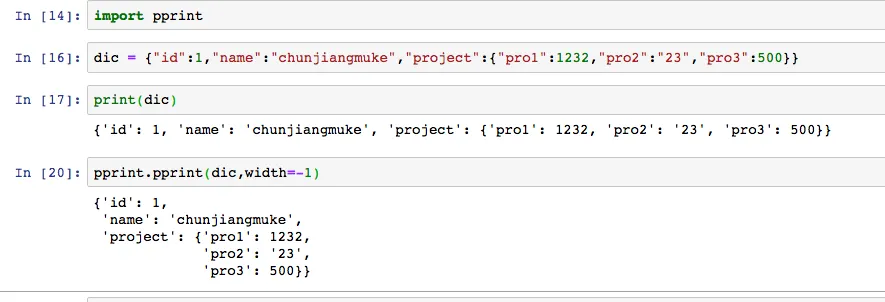
5. Pretty Printing with pprint
pprint makes dictionary or JSON output much more readable.
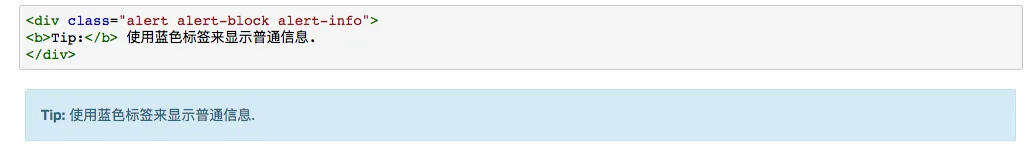
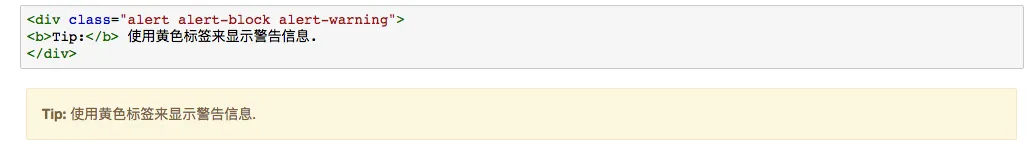
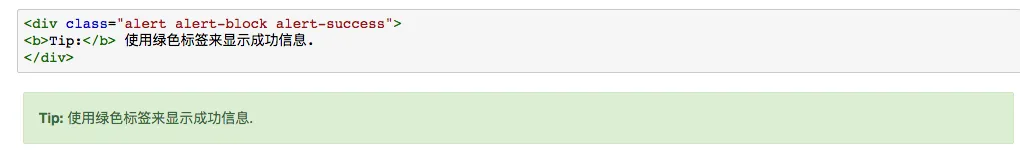
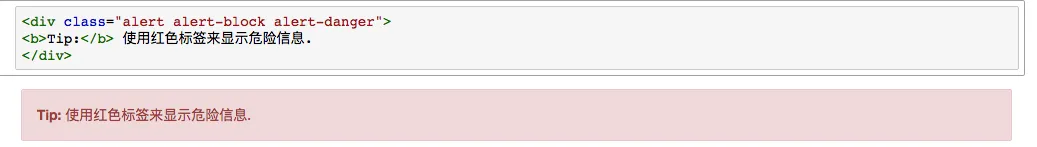
6. Highlight Comment Cells in Jupyter
Use different colors to highlight info, warnings, success, and danger.
Blue (info)
Yellow (warning)
Green (success)
Red (danger)
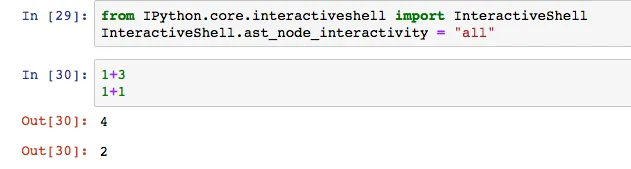
7. Show All Outputs in a Cell
By default, only the last output is shown in a cell.
To show all outputs:
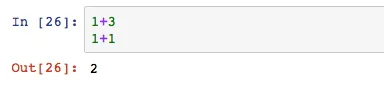
Use IPython’s InteractiveShell:
8. Use the -i Flag When Running Python Scripts
Normally we run:
python hello.py
If there’s an error, we don’t get much insight.
Instead, use:
python -i hello.py
Now you can inspect variables after it runs, even if there’s an error.

9. Quick Commenting with Ctrl + /
Select the code and press Ctrl + / to comment or uncomment it.
10. Undo Cell Deletion with ESC + Z
If you accidentally delete a whole cell, press ESC + Z to undo it.
Summary
This article collects several practical tricks for Python data analysis in Jupyter Notebook, from quick dataset inspection to debugging and interactive plotting. Small workflow improvements like these usually save more time than large refactors.
- 原文作者:春江暮客
- 原文链接:https://www.bobobk.com/en/385.html
- 版权声明:本作品采用 知识共享署名-非商业性使用-禁止演绎 4.0 国际许可协议 进行许可,非商业转载请注明出处(作者,原文链接),商业转载请联系作者获得授权。