Longest Palindromic Substring Algorithm - Manacher
Len array that allow it to run in $O(n)$ time.……
春江暮客的个人学习分享网站
Len array that allow it to run in $O(n)$ time.……
In a frequency distribution histogram, when the sample size is sufficiently enlarged to its limit, and the bin width is infinitely shortened, the step-like broken line in the frequency histogram will evolve into a smooth curve. This curve is called the density distribution curve of the population.
This article walks through how to use Seaborn with the Iris dataset in Pandas to plot several common kinds of kernel density curves.
import seaborn as sns
import pandas as pd
sns.set(color_codes=True)
sns.set_style("white")
df = pd.read_csv('iris.csv')
sns.kdeplot(df['sepal_width'])

To plot a kernel density curve using Seaborn, you only need to use kdeplot. Note that a density curve only requires one variable; here we choose the sepal_width column.
import seaborn as sns
import pandas as pd
sns.set(color_codes=True)
sns.set_style("white")
df = pd.read_csv('iris.csv')
sns.kdeplot(df['sepal_width'], fill=True)

Word clouds, which I’m sure you’ve all seen, are created using wordcloud, a famous Python library. This article will detail how to use wordcloud to create a word cloud for “Dream of the Red Chamber,” one of China’s Four Great Classical Novels.
This involves three parts:
You can install them with pip install wordcloud and pip install jieba.
The .txt file and the font file are bundled so this example is easier to reproduce.
Here’s the code directly:
from wordcloud import WordCloud
import jieba
import matplotlib.pyplot as plt
text = "".join(jieba.cut(open("红楼梦.txt").read()))
wordcloud = WordCloud(font_path="kaibold.ttf").generate(text)
# Display the generated image:
plt.imshow(wordcloud, interpolation='bilinear')
plt.axis("off")
plt.margins(x=0, y=0)
plt.show()

yield with practical examples, including how generator execution pauses and resumes, when generators are useful, and a few common mistakes beginners hit.……
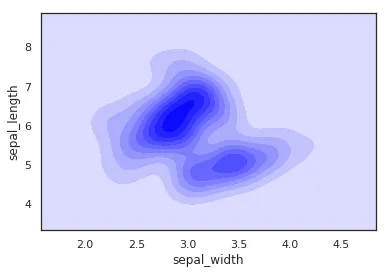
Today, while using Python’s Seaborn to plot a heatmap (clustermap), I kept encountering this error. My data seemed perfectly fine, and a Google search didn’t yield any good solutions. After some exploration, I’m sharing the final solution here.
Although the error appears inside Seaborn, the more common root cause is that the DataFrame being passed into plotting has become object dtype instead of a numeric dtype.
import pandas as pd
import numpy as np
import matplotlib.pyplot as plt
from seaborn import clustermap
import seaborn as sns; sns.set(color_codes=True)
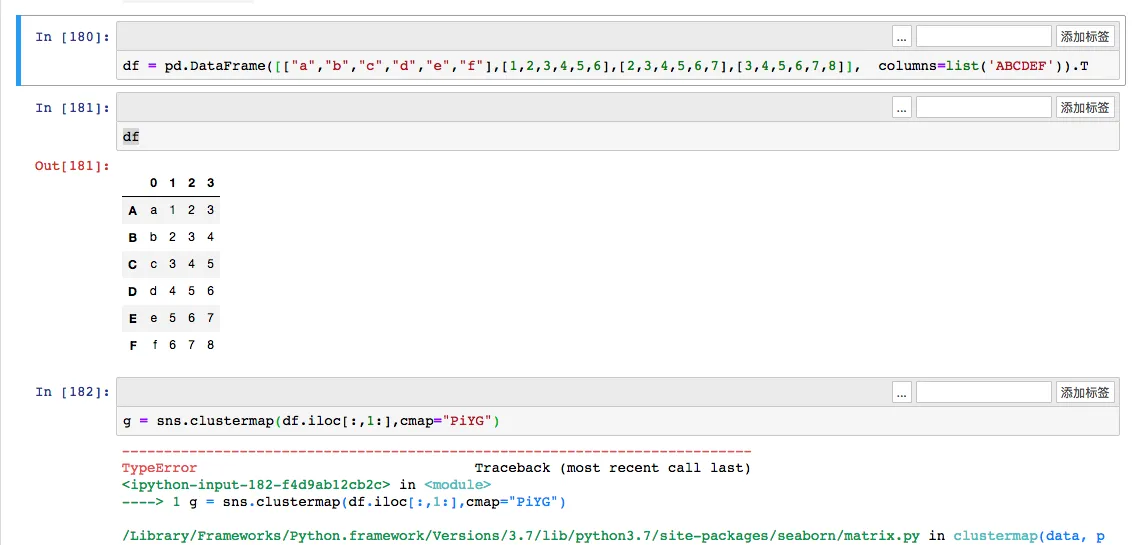
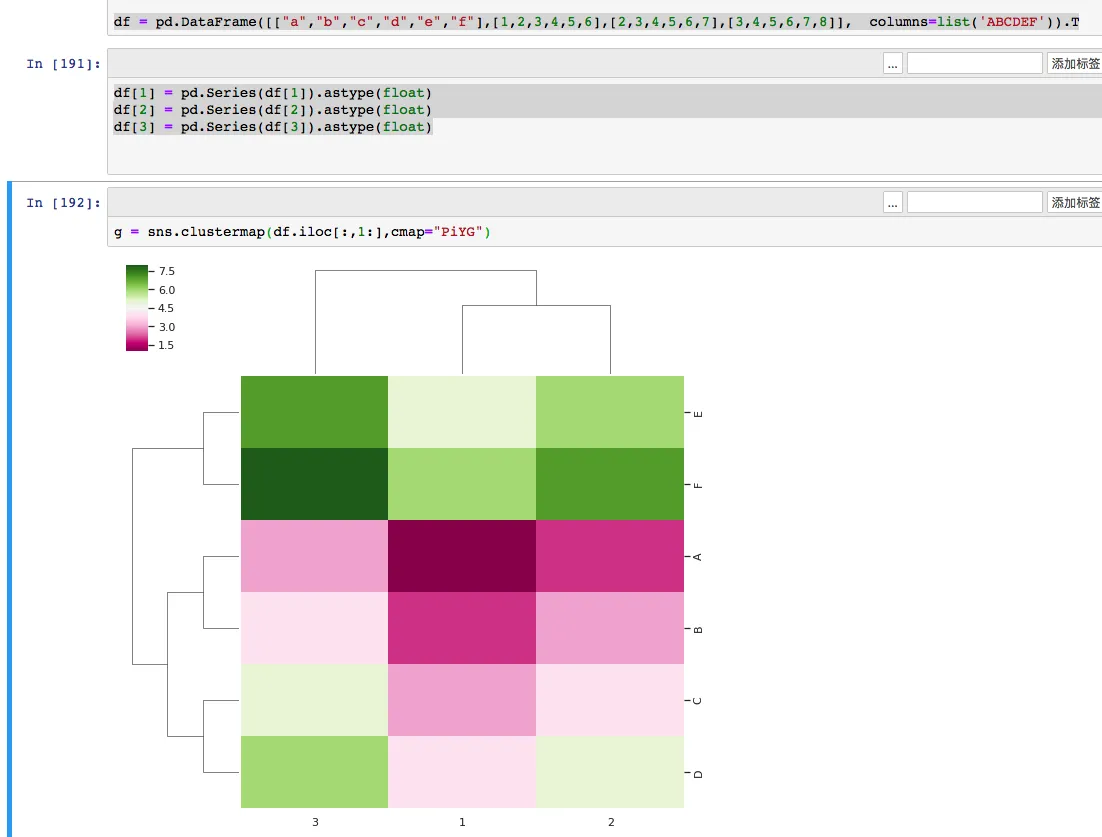
df = pd.DataFrame([["a","b","c","d","e","f"],[1,2,3,4,5,6],[2,3,4,5,6,7],[3,4,5,6,7,8]], columns=list('ABCDEF')).T
df
g = sns.clustermap(df.iloc[:,1:],cmap="PiYG")
After generating and transposing the DataFrame, a TypeError occurs: TypeError: ufunc 'isnan' not supported for the input types, and the inputs could not be safely coerced to any supported types according to the casting rule "safe".

After implementing python for Qianqian Music mp3 download, some users found that many songs couldn’t be searched on Qianqian Music. So today, Chunjian Muke extended the download functionality to Kugou Music, with source code provided.
Using the same approach, first search for a song directly on the Kugou official website. Then, open the network monitor in Google Chrome and search for the same keyword again. You’ll then be able to find the API information (Note: It’s best to view the network requests during the second search to filter out unnecessary information).
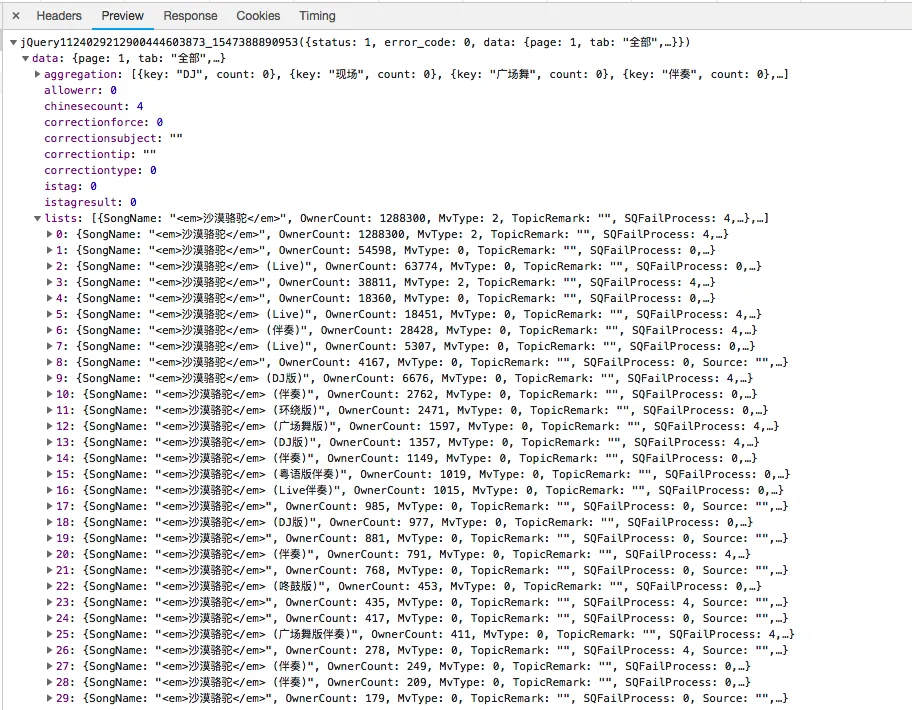
With only 4 network requests, it’s easy to identify that the first request genuinely returns song information, so we can construct this request.

NetworkX, style edges by weight, and adjust background appearance for cleaner relationship visualizations.……