春江暮客

春江暮客的个人学习分享网站

分类 Technology 中的文章

Python Implementation for Kugou Music MP3 Download

Python Implementation for Kugou Music MP3 Download

2019年1月13日 | Technology

After implementing python for Qianqian Music mp3 download, some users found that many songs couldn’t be searched on Qianqian Music. So today, Chunjian Muke extended the download functionality to Kugou Music, with source code provided.

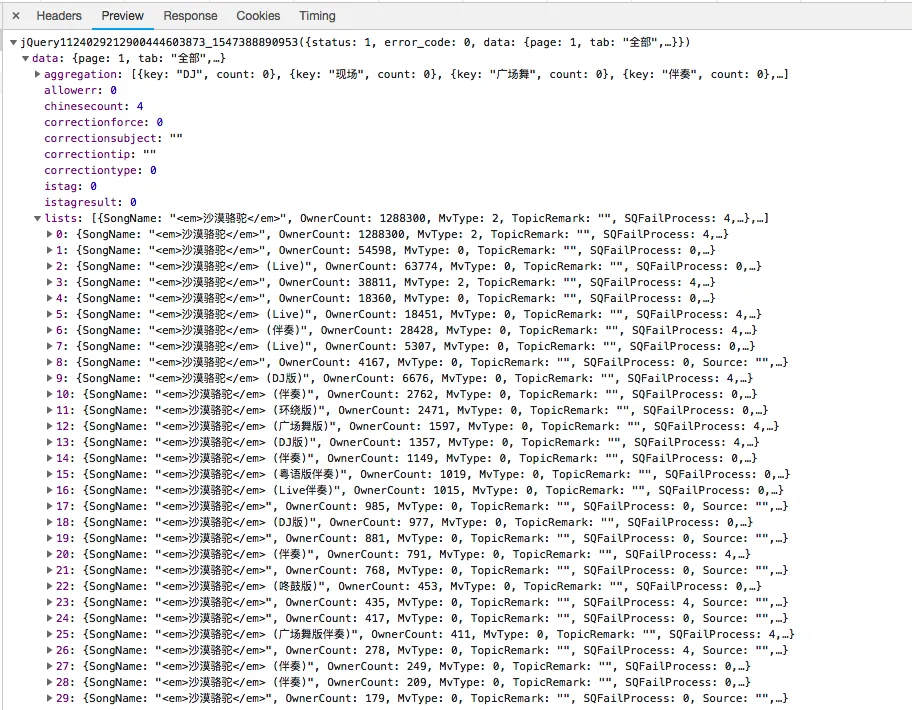
Using the same approach, first search for a song directly on the Kugou official website. Then, open the network monitor in Google Chrome and search for the same keyword again. You’ll then be able to find the API information (Note: It’s best to view the network requests during the second search to filter out unnecessary information).


1. Analyzing Search API Information

《Python Implementation for Kugou Music MP3 Download》 
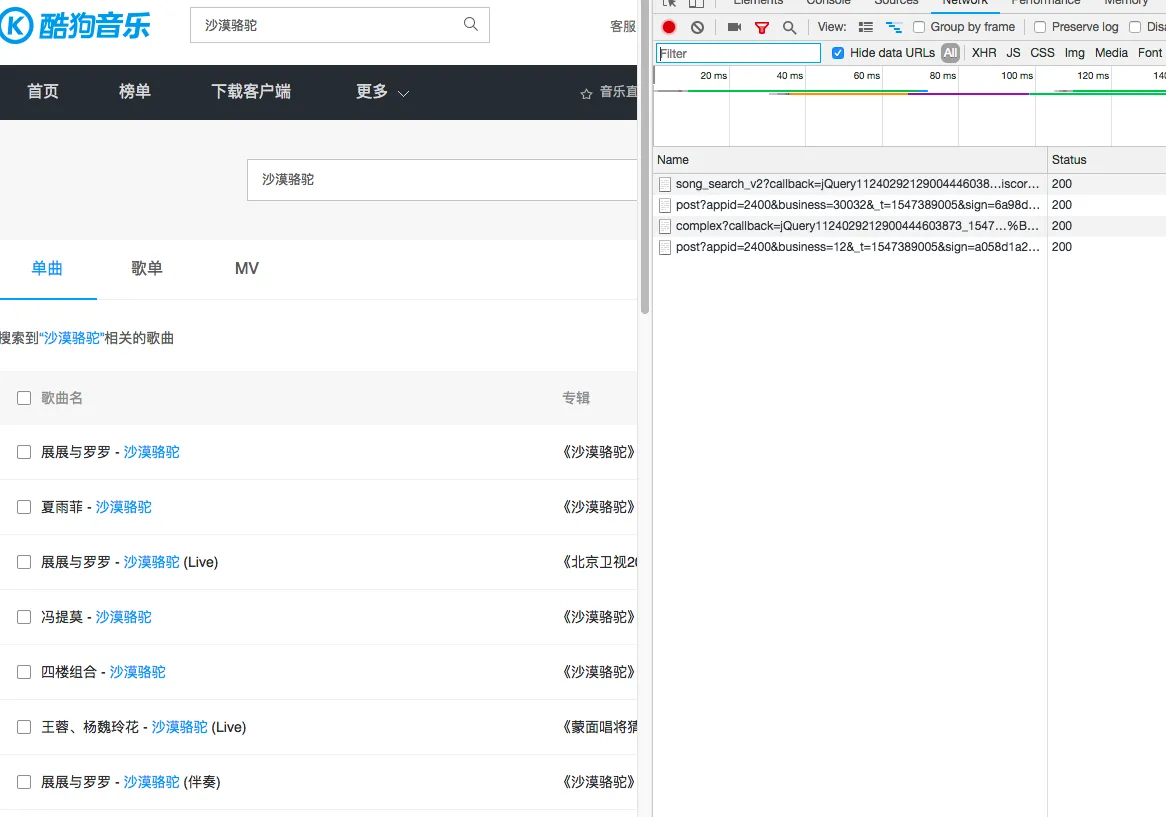
With only 4 network requests, it’s easy to identify that the first request genuinely returns song information, so we can construct this request.

《Python Implementation for Kugou Music MP3 Download》

……

阅读全文

Drawing Violin Plots with Seaborn

Drawing Violin Plots with Seaborn

2019年1月4日 | Technology

Introduction

A violin plot is used to display the distribution and probability density of multiple data groups. Similar to a box plot, it offers a better representation of data density. Violin plots are particularly useful when dealing with very large datasets that are difficult to display individually. Python’s Seaborn package makes it very convenient to create violin plots.

If you only need the median and quartiles, a box plot is often enough. If you also want to see whether the data looks skewed, wide, narrow, or even bimodal, a violin plot is usually more informative.

Parameters

Drawing Violin Plots with Seaborn

The parameters corresponding to each position in a violin plot are shown above. The middle line represents the box plot data, specifically the 25th, 50th (median), and 75th percentiles. The thin lines indicate the 95% confidence interval.

Drawing Violin Plots with Seaborn

Single Variable Data

While a box plot would suffice for a single variable, a violin plot can certainly be used as well:

……

阅读全文

The difference between shallow copy and deepcopy in Python

The difference between shallow copy and deepcopy in Python

2018年12月29日 | Technology

In Python, copying objects is common, and a lot of “why did both variables change?” bugs come from mixing up three different operations: assignment, shallow copy, and deep copy.

“The difference between shadowcopy and deepcopy in python”

Among assignment (=), shallow copy (copy), and deep copy (deepcopy), the most confusing part is usually not assignment vs. copy, but whether a shallow copy still shares nested mutable objects.

Assignment does not copy an object. It only binds another variable name to the same object. Because of that, changes seen through one variable are still changes to the same underlying object.

A shallow copy duplicates the outer container, but nested mutable objects may still be shared. A deep copy recursively duplicates nested objects too, so it is usually more isolated.

A practical rule of thumb is:

  • Use assignment when you only want another name for the same object.
  • Use shallow copy when copying the outer container is enough.
  • Use deep copy when nested lists or dictionaries also need to be independent.

Below is a practical code example illustrating the differences among the three.

……

阅读全文

python3 requests module usage examples

python3 requests module usage examples

2018年12月28日 | Technology
This article explains common Python requests usage through examples including GET, POST, headers, authentication, file download, upload, and cookies, with a couple of practical habits that make real scripts more reliable.……

阅读全文

Kaggle Local Dog Breed Recognition

Kaggle Local Dog Breed Recognition

2018年12月15日 | Technology
This article shows how to run local dog-image prediction with a pretrained ResNet50 model, covering image preprocessing, model loading, prediction decoding, and the files needed for local inference.……

阅读全文

Recursively download files python

Recursively download files python

2018年12月8日 | Technology
This article shows how to use Python and requests to recursively download all files and subdirectories from a directory index page, which is useful for simple website backups or directory mirroring.……

阅读全文

Drawing the Butterfly Curve with Python

Drawing the Butterfly Curve with Python

2018年11月7日 | Technology

The butterfly curve, discovered by Temple H. Fay, is a beautiful curve that can be expressed using a polar coordinate function. Because of its elegance, I wanted to use it as my blog’s favicon.ico. Here, I’ll use Python’s matplotlib.pyplot package to draw the desired butterfly curve. First, let’s admire the beautiful butterfly curve.


butter

1. First, We Need to Define the Mathematical Expression of the Butterfly Curve

math

math2

It can also be expressed using spherical coordinates:

math3


2. Choosing matplotlib.pyplot as the Plotting Tool in Python

1. First, import the necessary Python packages

import numpy as np
import matplotlib.pyplot as plt

2. Set the parameter values

t = np.arange(0.0, 12*np.pi, 0.01)
x = np.sin(t)*(np.e**np.cos(t) - 2*np.cos(4*t)-np.sin(t/12)**5)
y = np.cos(t)*(np.e**np.cos(t) - 2*np.cos(4*t)-np.sin(t/12)**5)

3. According to the formula, use numpy functions with plt to draw the required image

plt.figure(figsize=(8,6))
plt.axis('off')
plt.plot(x,y,color='blue',linewidth = '2')
#plt.show()
plt.savefig("butter.jpg",dpi=400)

butter_fly

4. Use Pillow to resize the image to an appropriate size for a favicon

from PIL import Image
im = Image.open("butter.jpg")
favicon = im.resize((50,50))
favicon.save("favicon.ico")

image_ico

……

阅读全文

友情链接

其它